Rankings
Best per Category
Best $30 Scratchers to buy in CA
Top odds among $30 tickets
Best $20 Scratchers to buy in CA
Top odds among $20 tickets
Best $10 Scratchers to buy in CA
Top odds among $10 tickets
Best $5 Scratchers to buy in CA
Top odds among $5 tickets
Best $3 Scratchers to buy in CA
Top odds among $3 tickets
Best $2 Scratchers to buy in CA
Top odds among $2 tickets
Best $1 Scratchers to buy in CA
Top odds among $1 tickets
Best CA Scratchers by Current Winning Odds
#1
$30
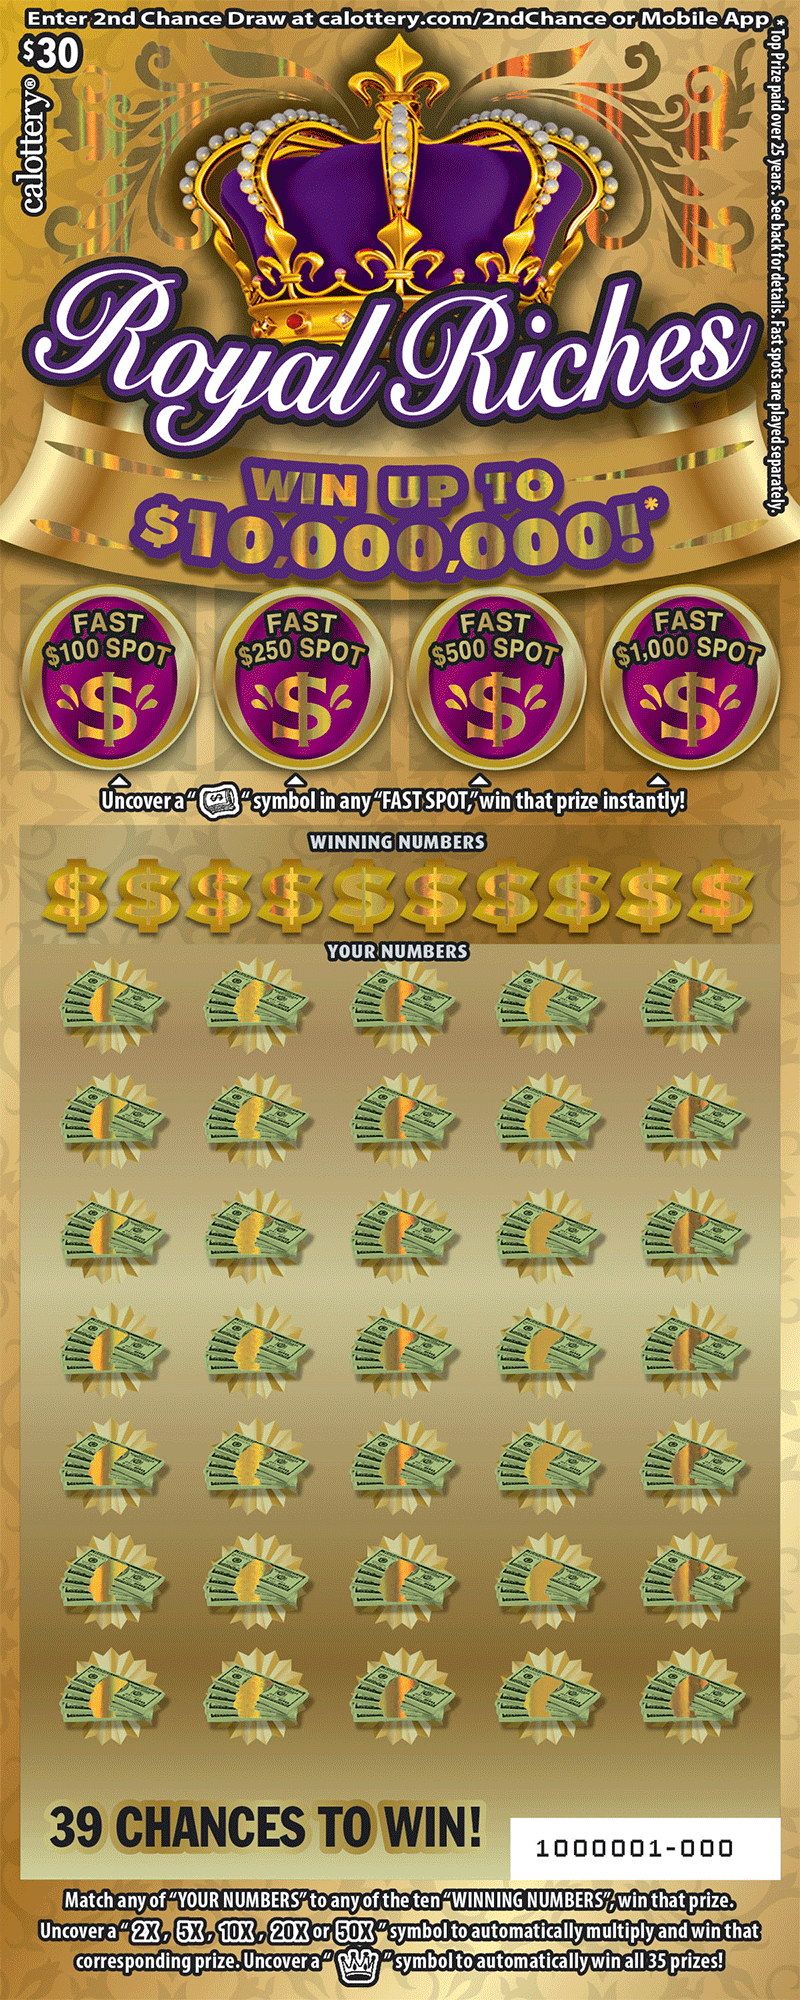
Royal Riches
Current Odds
1 in 2.53
+6.69%
Top Prize
$10,000,000
#2
$10
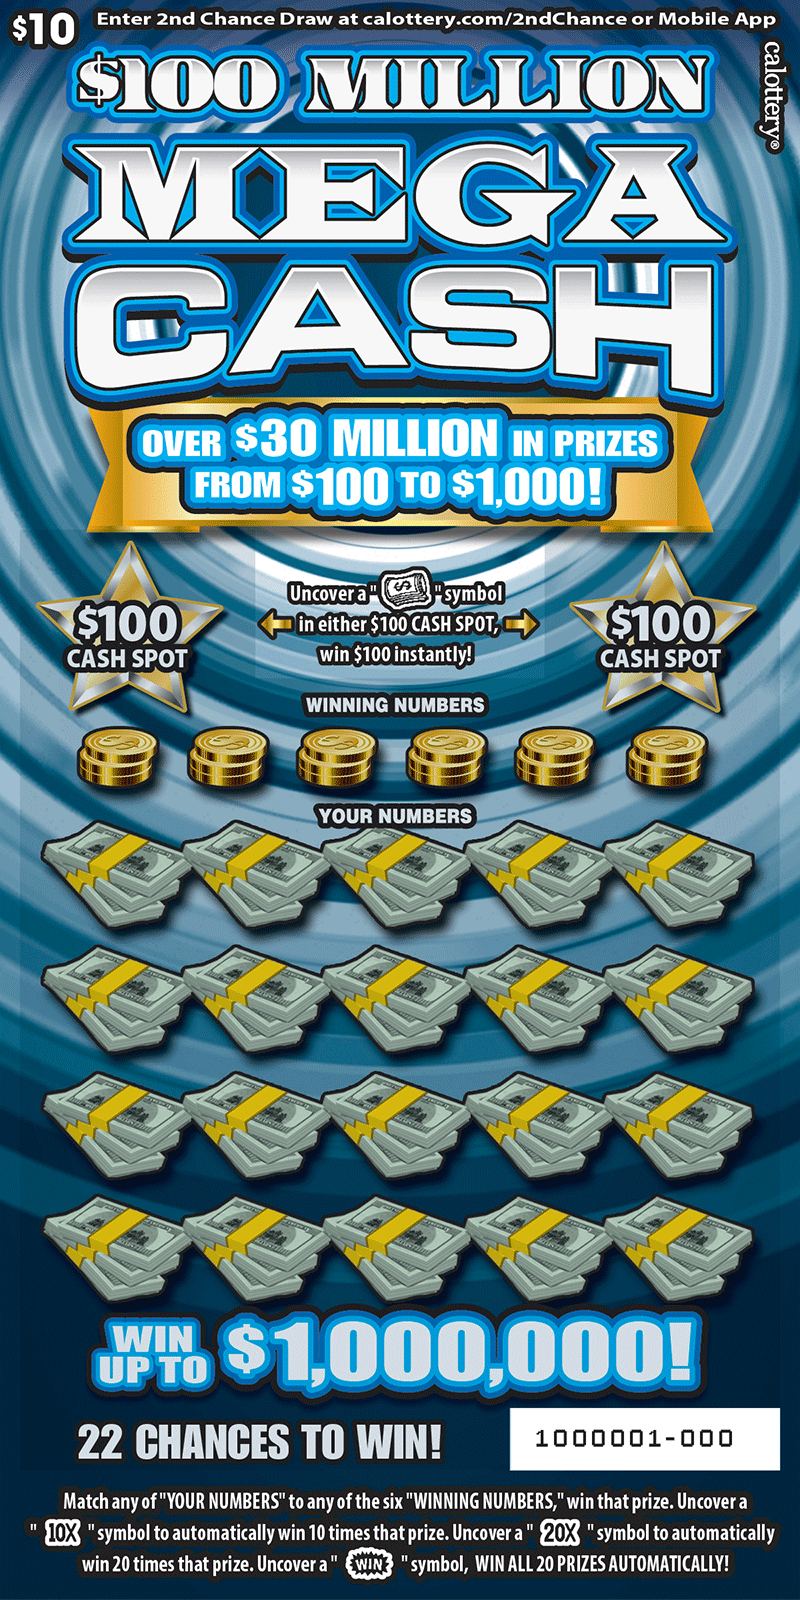
$100 Million Mega Cash
Current Odds
1 in 2.76
+9.13%
Top Prize
$1,000,000
#3
$30
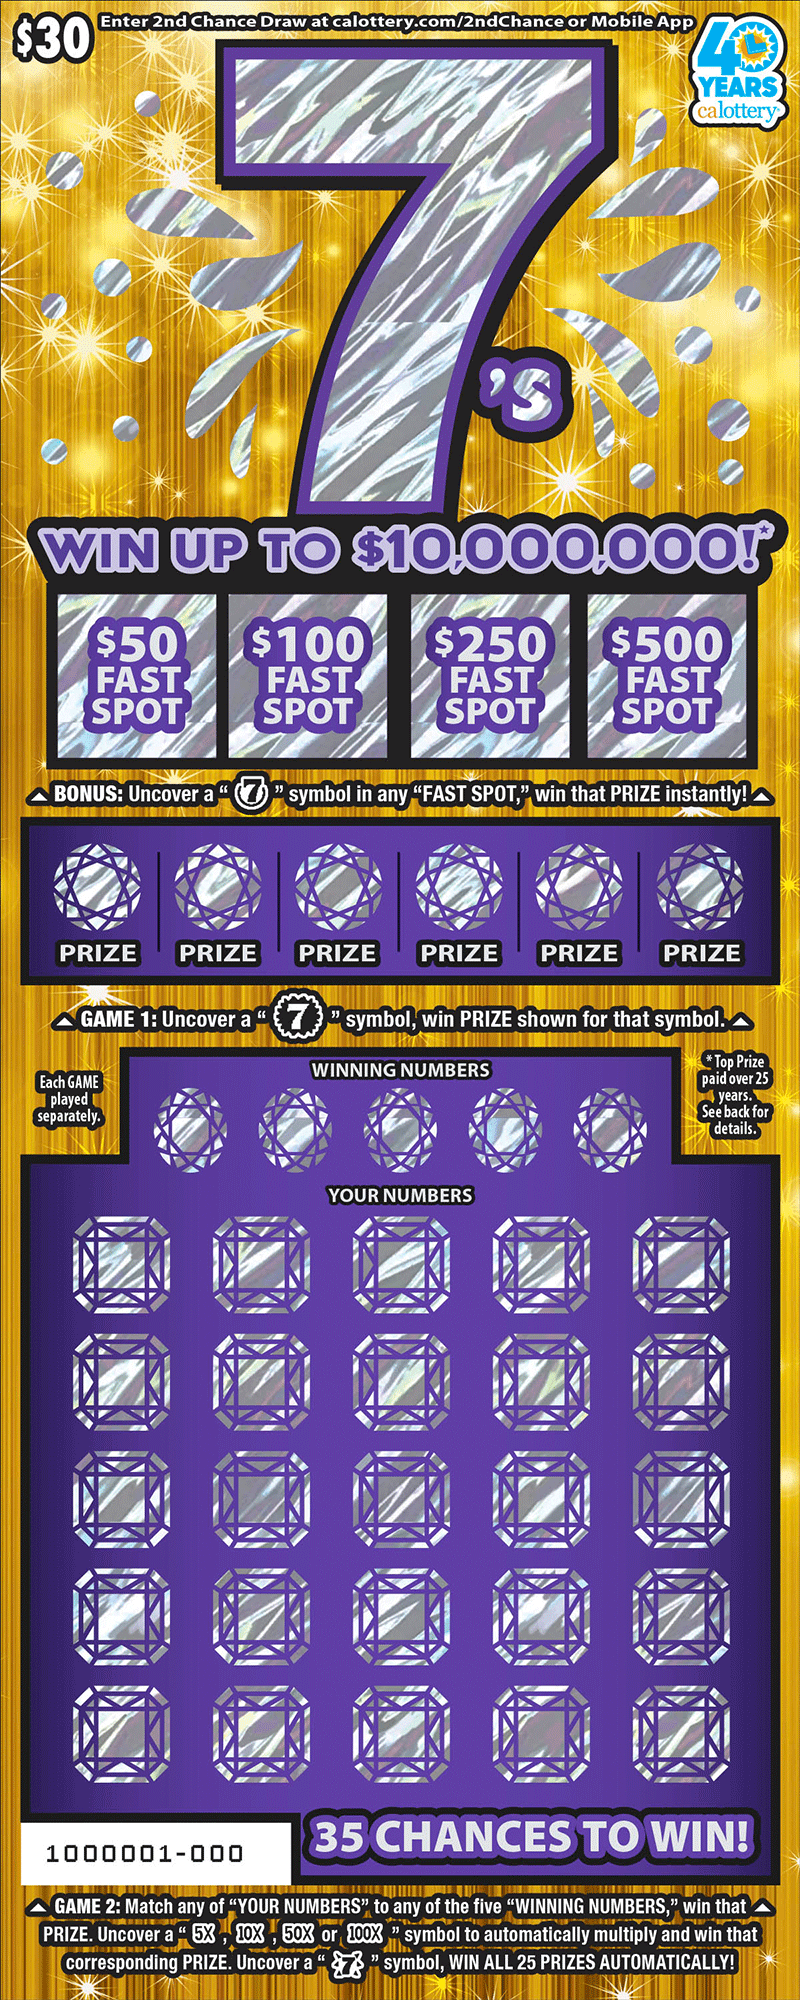
7's
Current Odds
1 in 2.79
-2.81%
Top Prize
$10,000,000
#4
$10
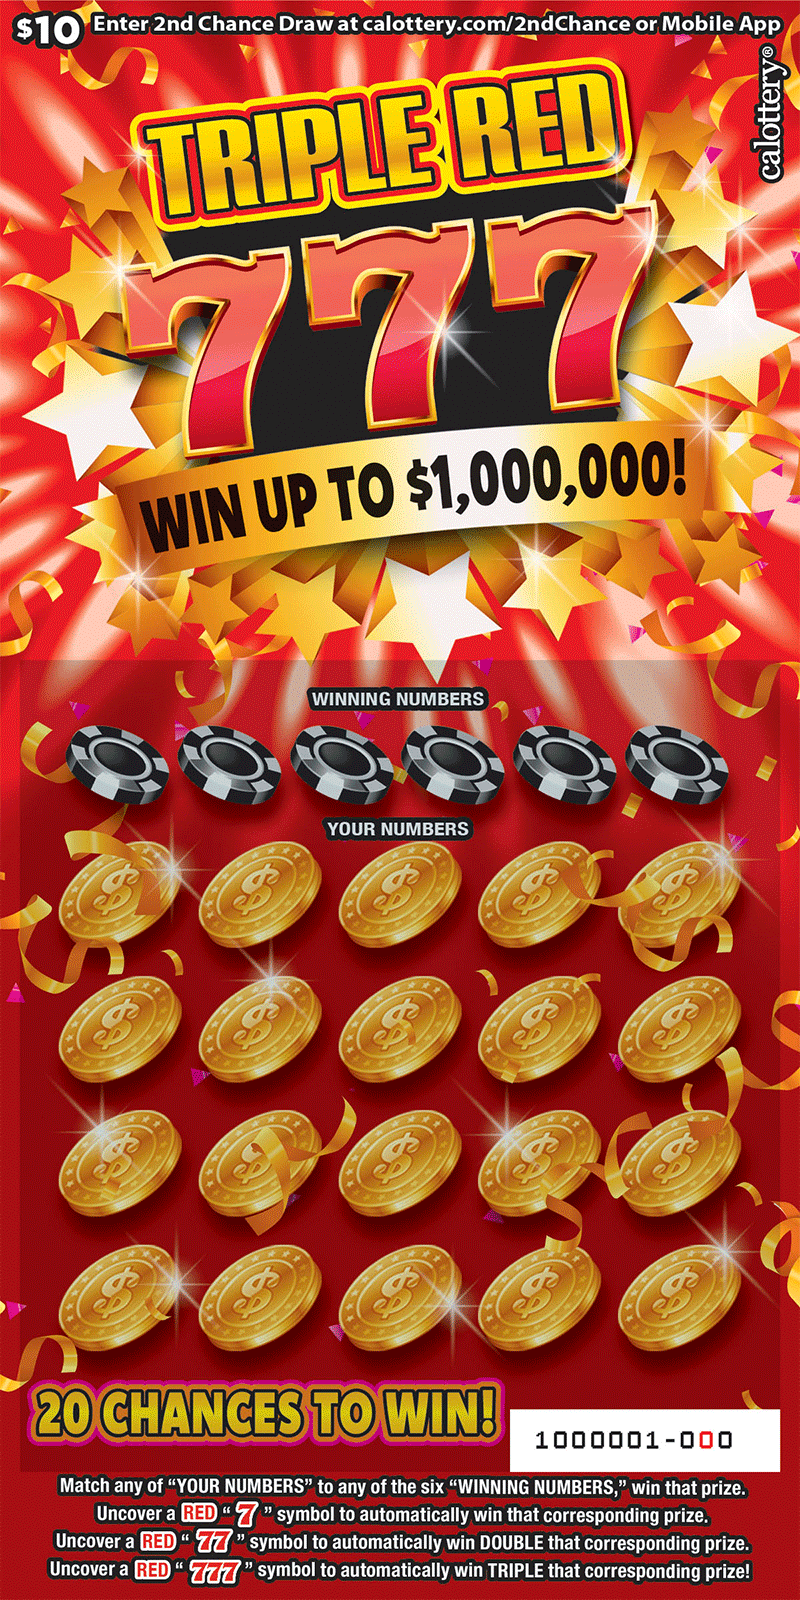
Triple Red 777
Current Odds
1 in 2.8
+0.08%
Top Prize
$1,000,000
#5
$30
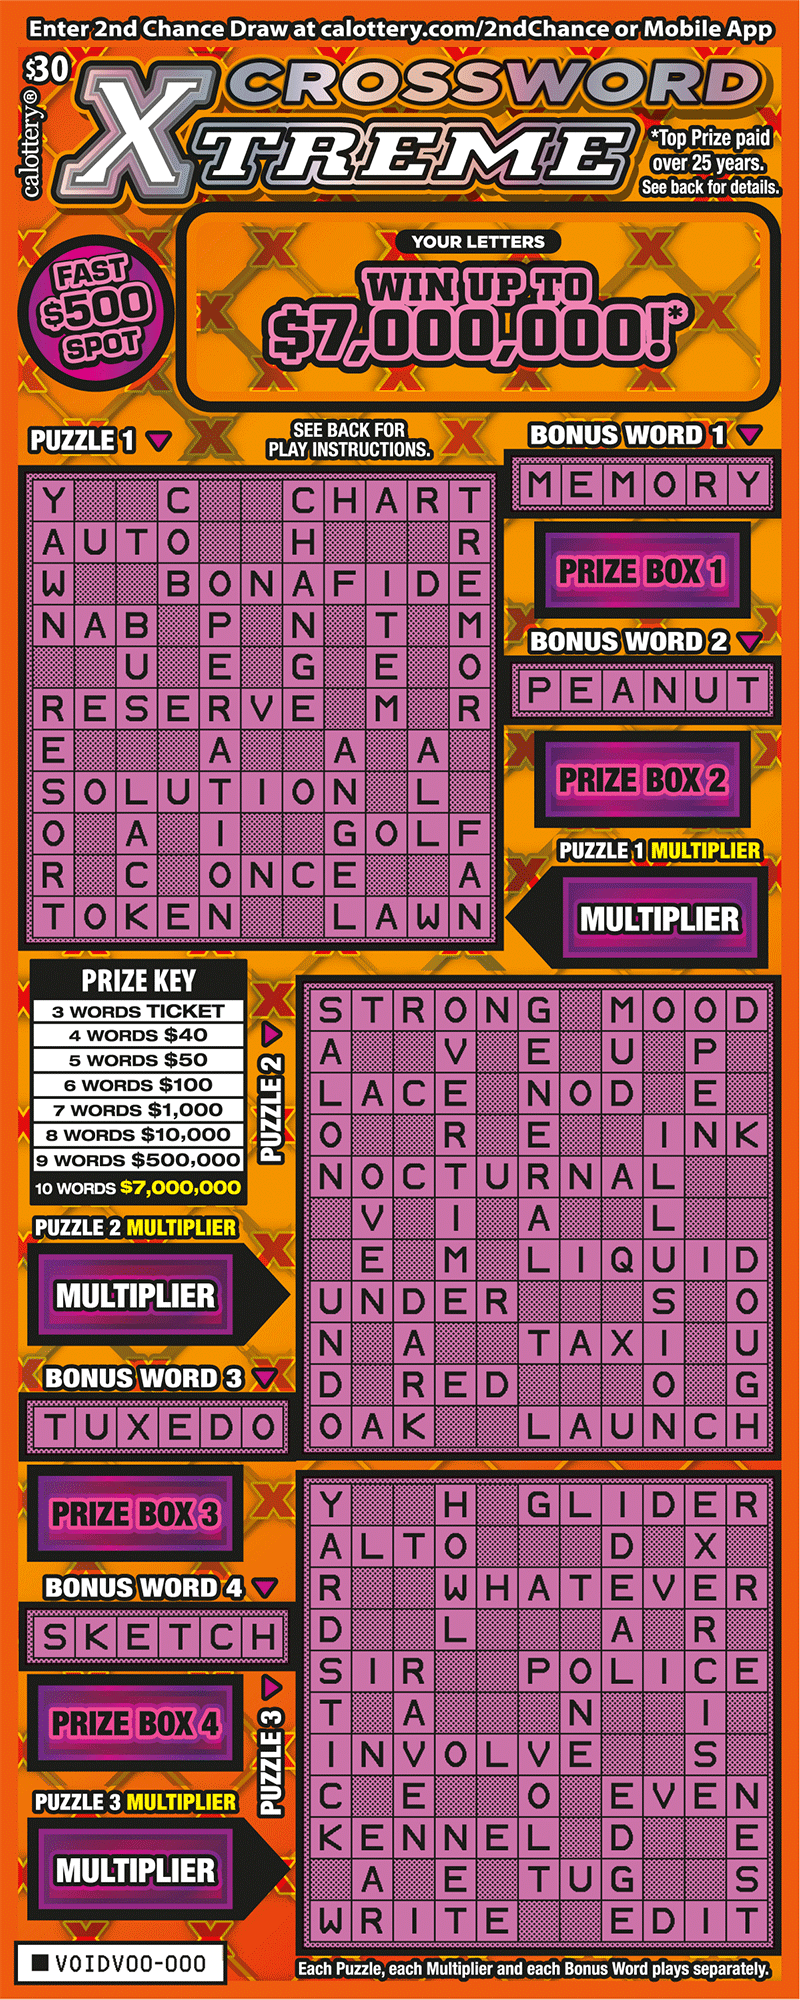
Crossword Xtreme
Current Odds
1 in 2.83
-4.03%
Top Prize
$7,000,000
#6
$20
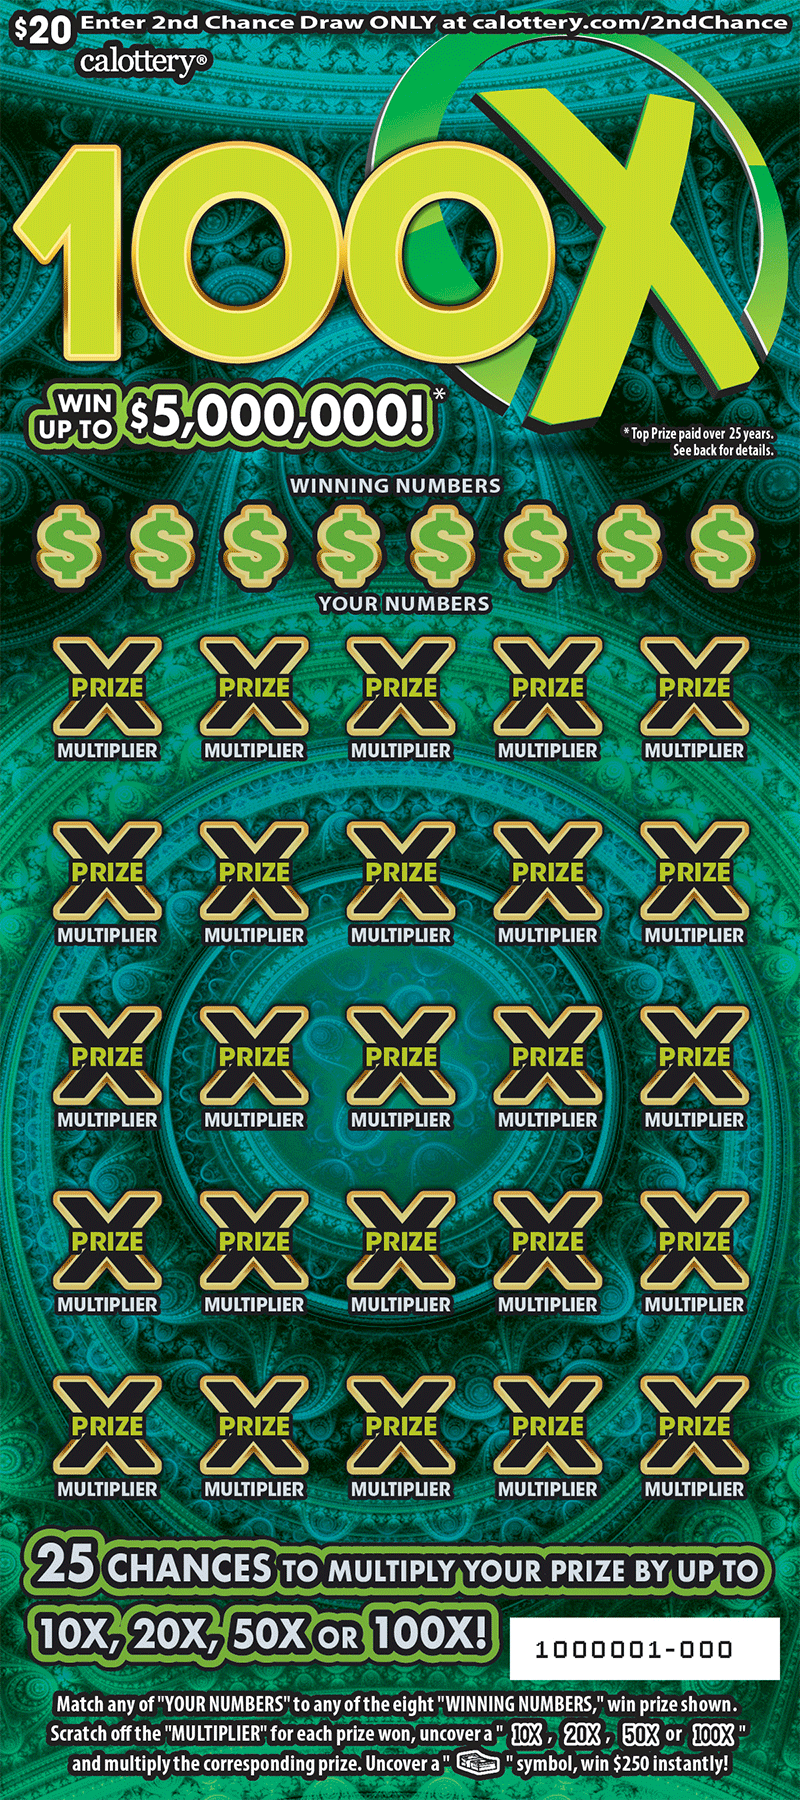
100X
Current Odds
1 in 3.01
-0.61%
Top Prize
$5,000,000
#7
$20
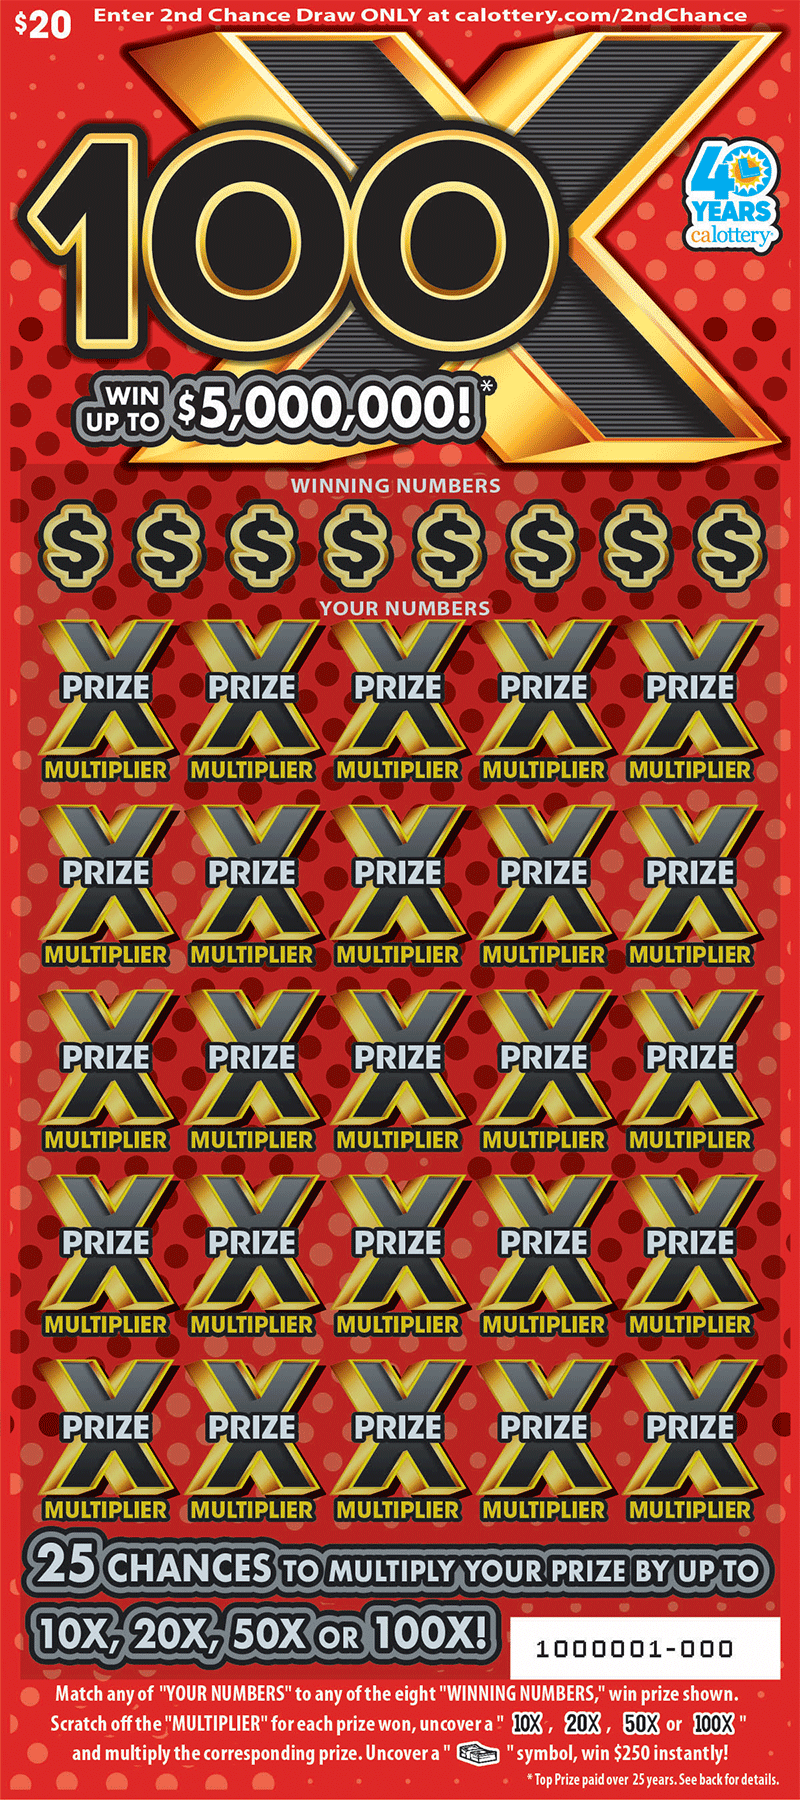
100X
Current Odds
1 in 3.02
-0.87%
Top Prize
$5,000,000
#8
$20
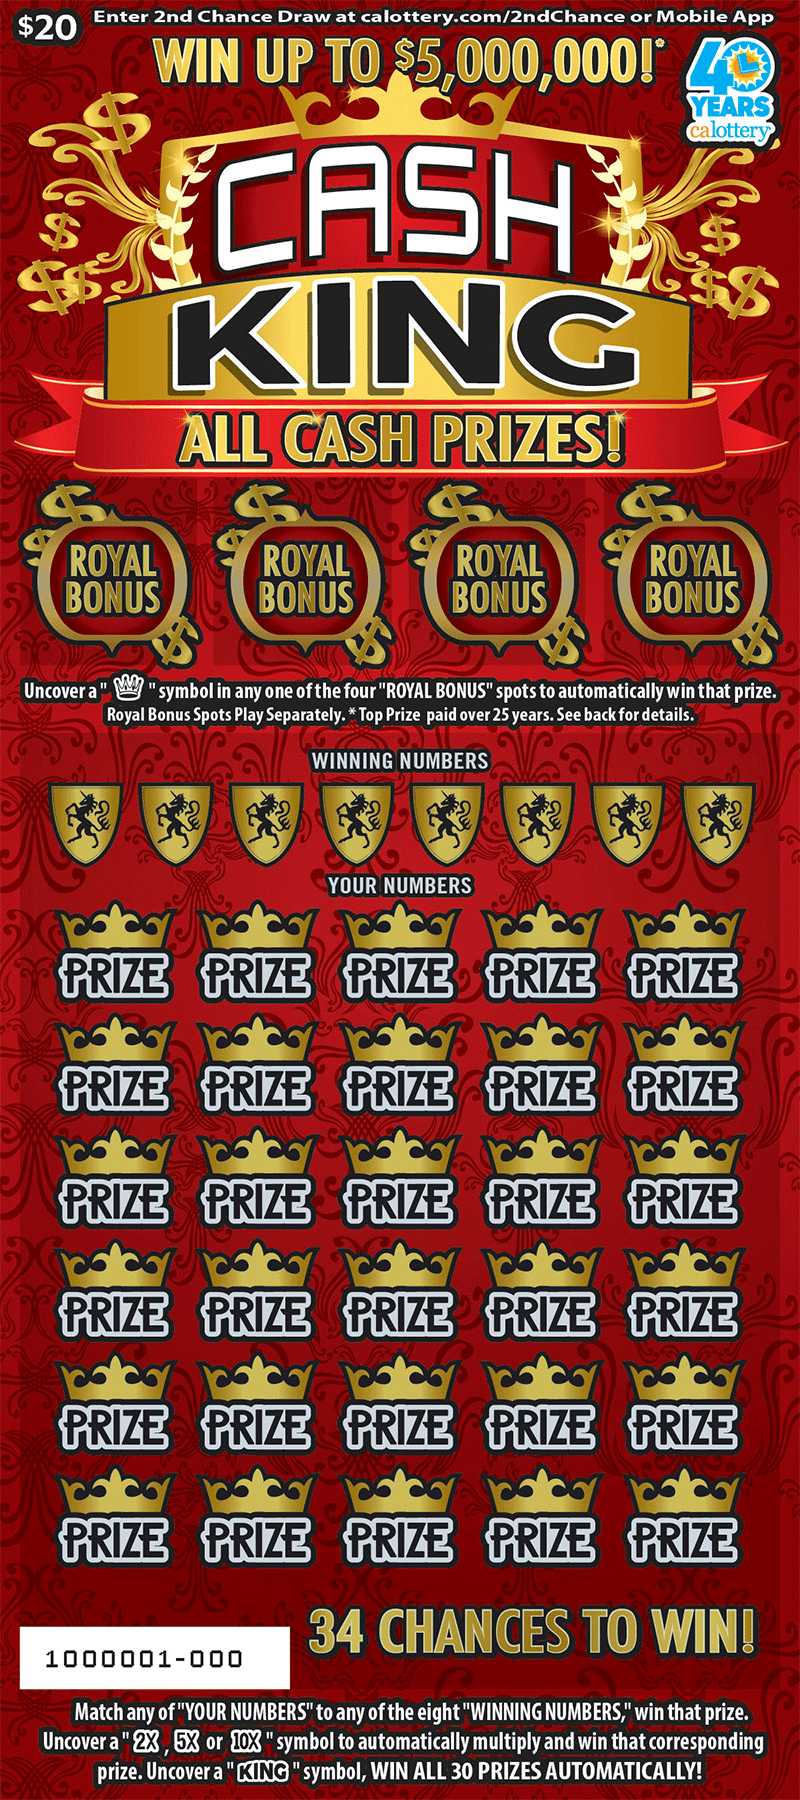
Cash King
Current Odds
1 in 3.03
-1.07%
Top Prize
$5,000,000
#9
$30
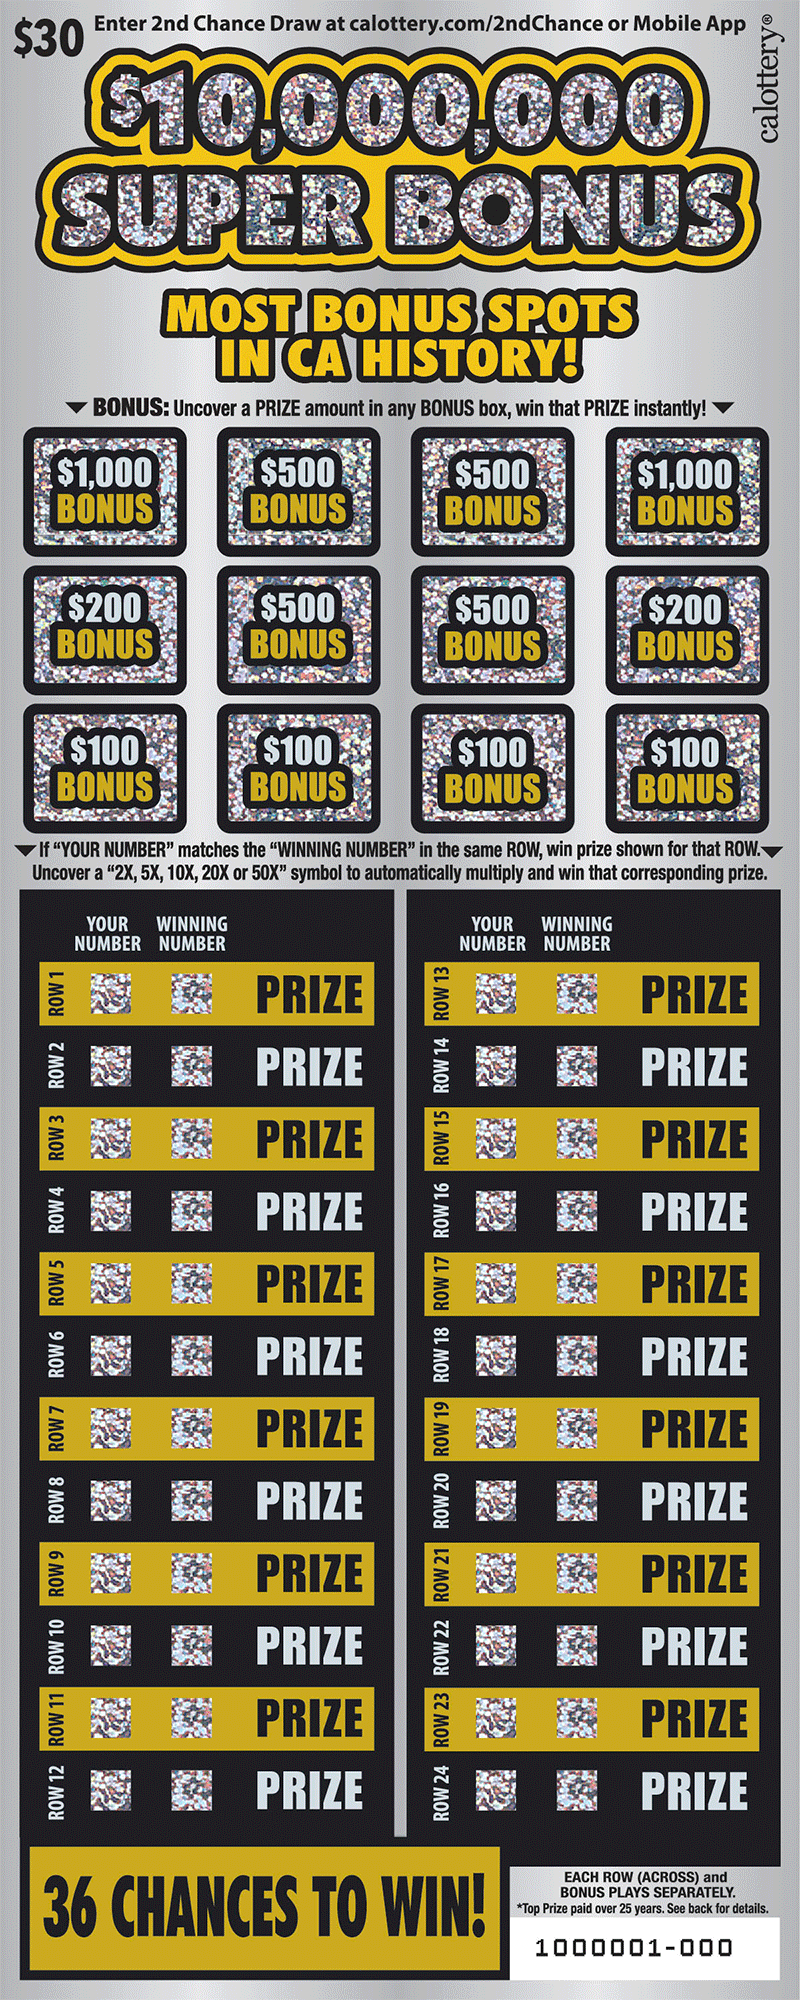
$10,000,000 Super Bonus
Current Odds
1 in 3.06
+3.71%
Top Prize
$10,000,000
#10
$5
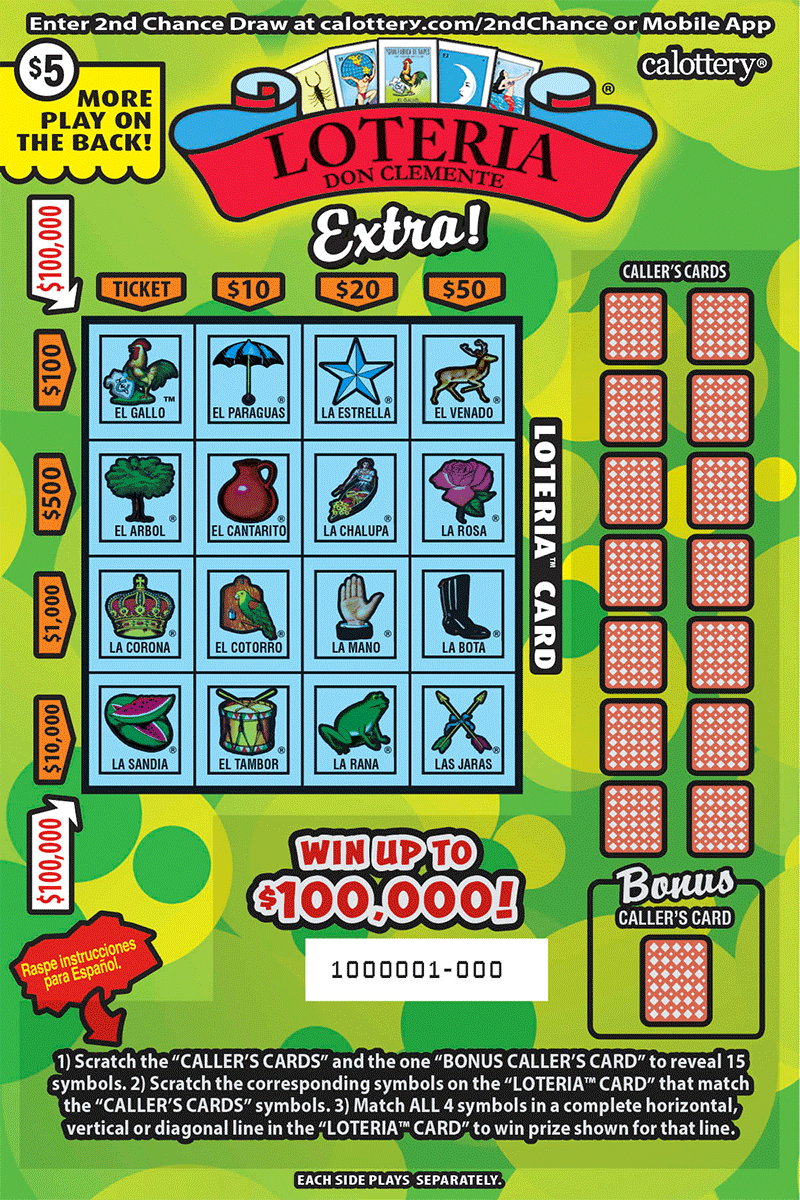
LOTERIA™ Extra!
Current Odds
1 in 3.08
+12.07%
Top Prize
$100,000
#11
$10
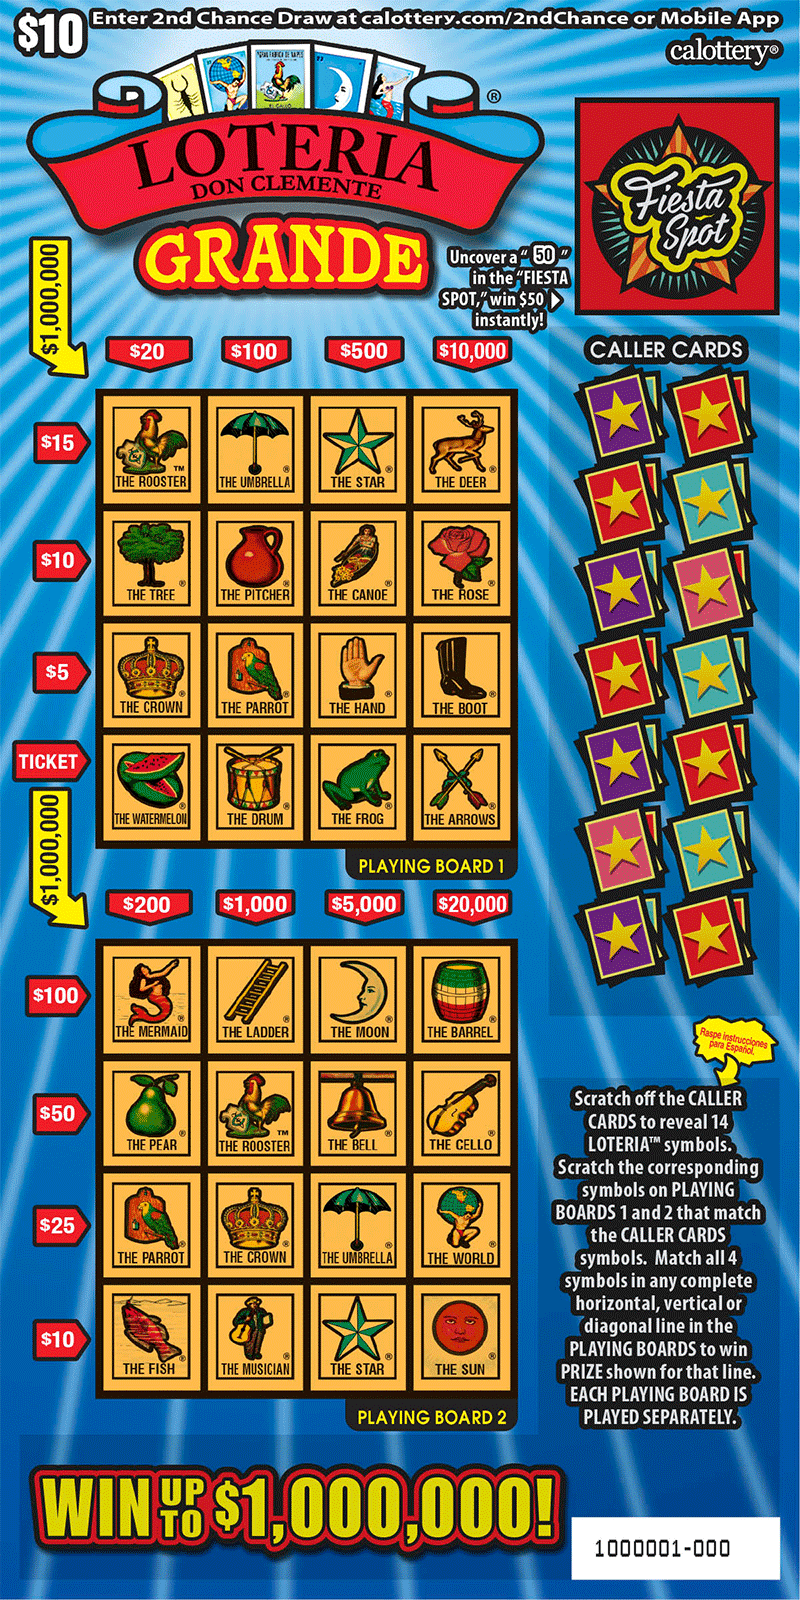
LOTERIA GRANDE
Current Odds
1 in 3.09
+13.31%
Top Prize
$1,000,000
#12
$20
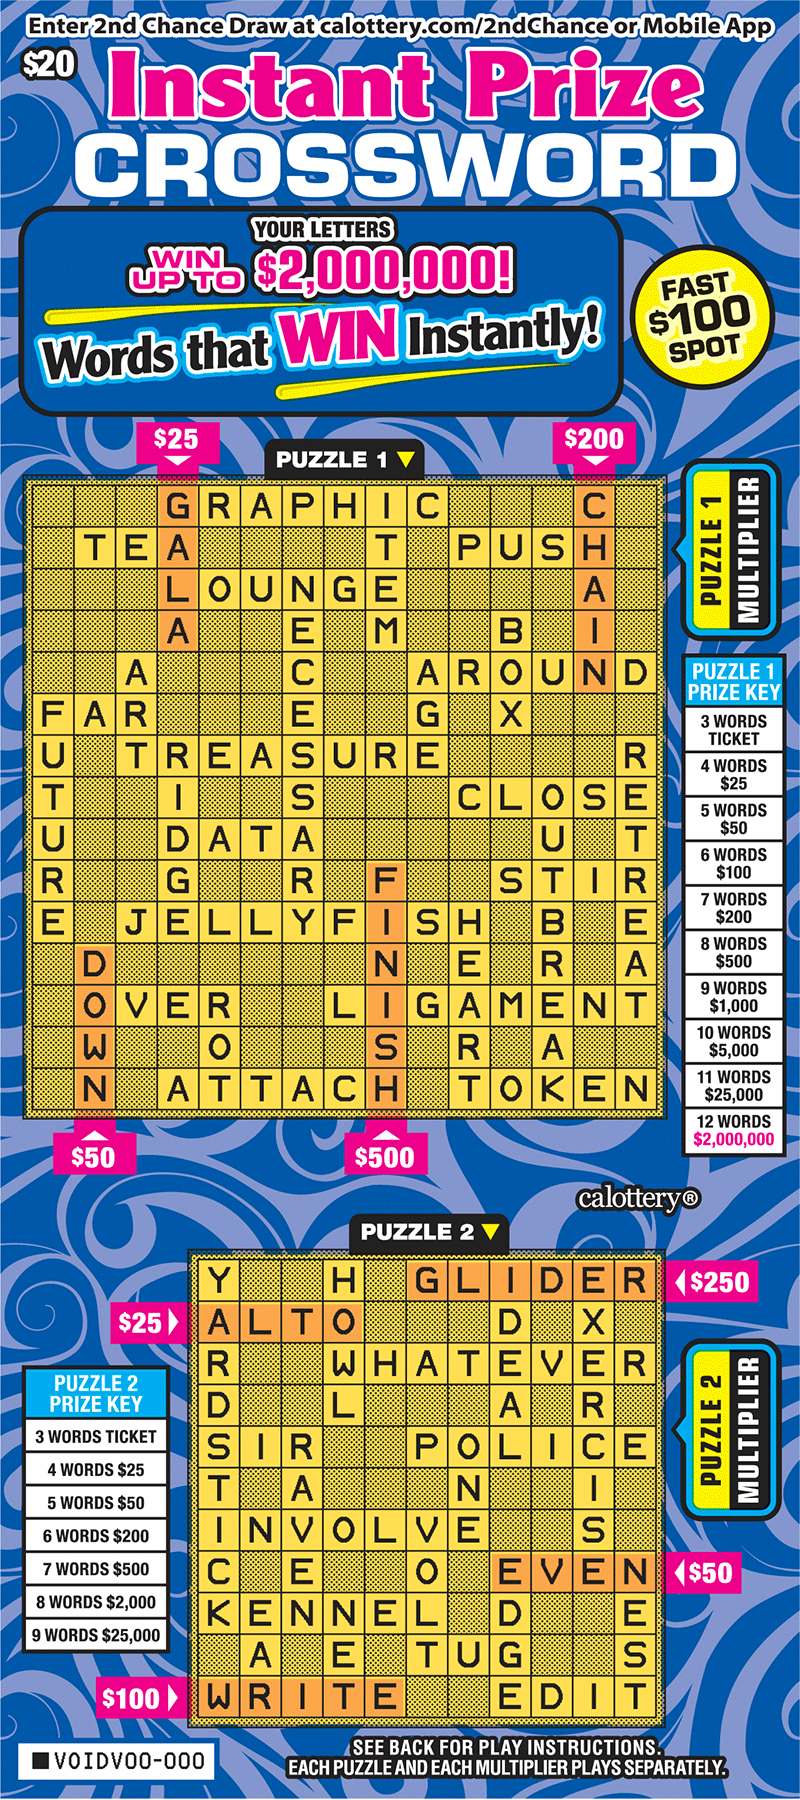
Instant Prize Crossword
Current Odds
1 in 3.12
+5.69%
Top Prize
$2,000,000
#13
$40
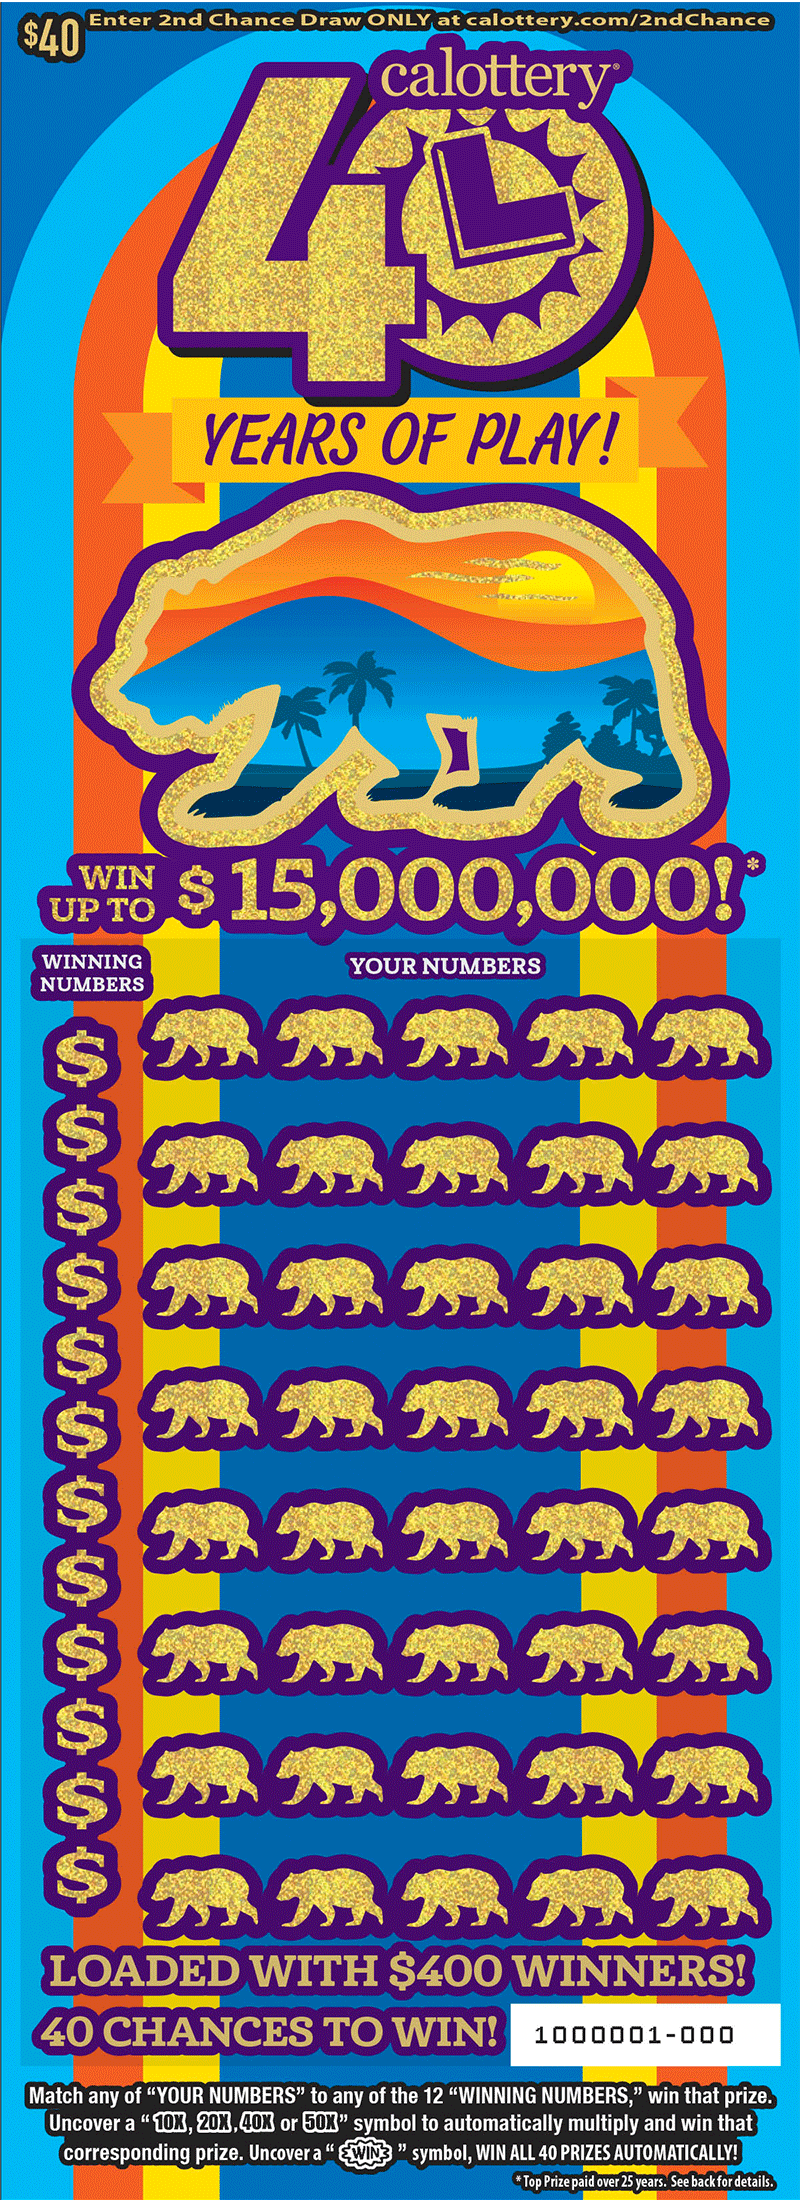
40 Years of Play!
Current Odds
1 in 3.17
-11.09%
Top Prize
$15,000,000
#14
$20
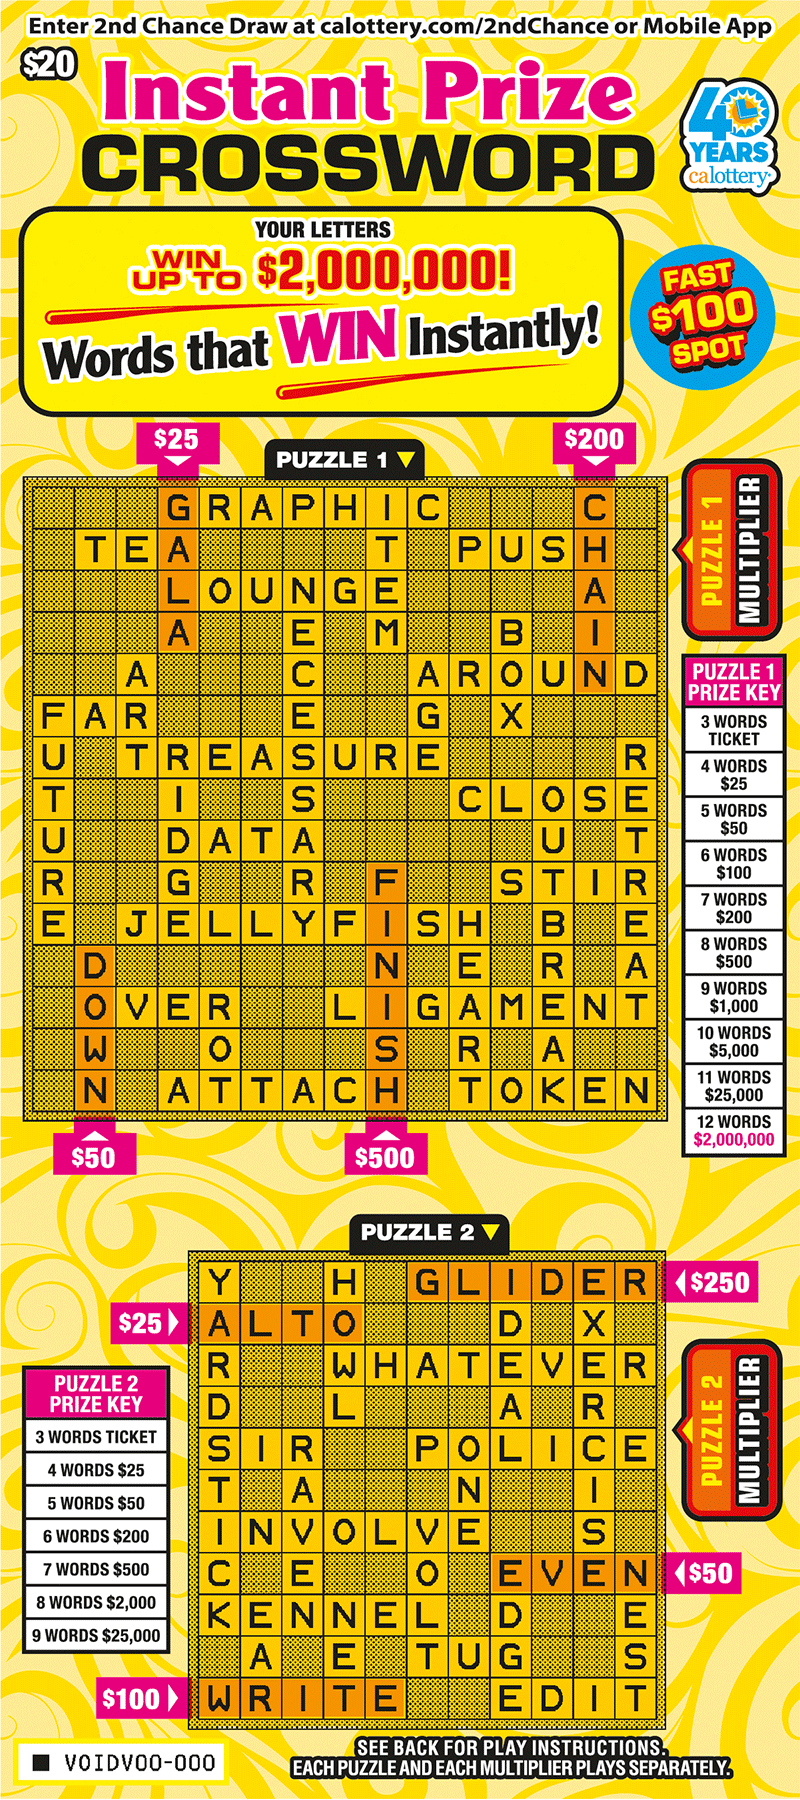
Instant Prize Crossword
Current Odds
1 in 3.25
+1.73%
Top Prize
$2,000,000
#15
$5
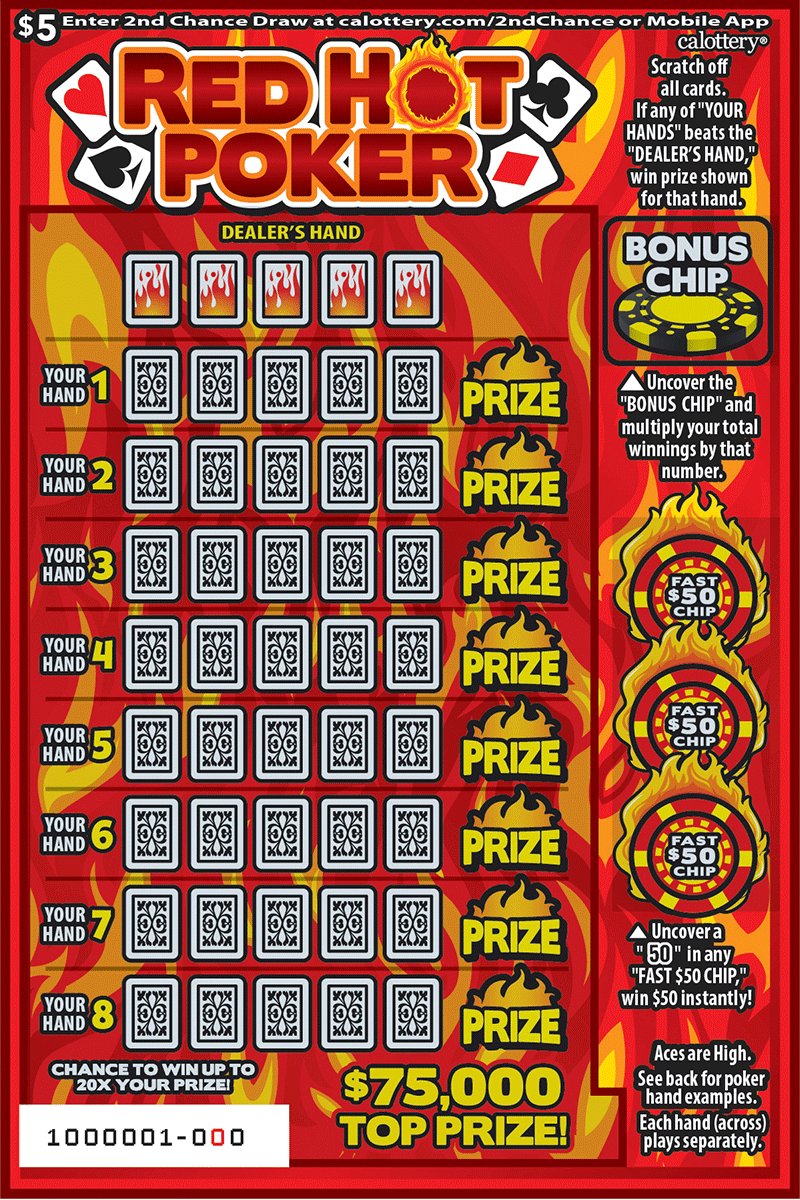
Red Hot Poker
Current Odds
1 in 3.25
+6.73%
Top Prize
$75,000
#16
$20
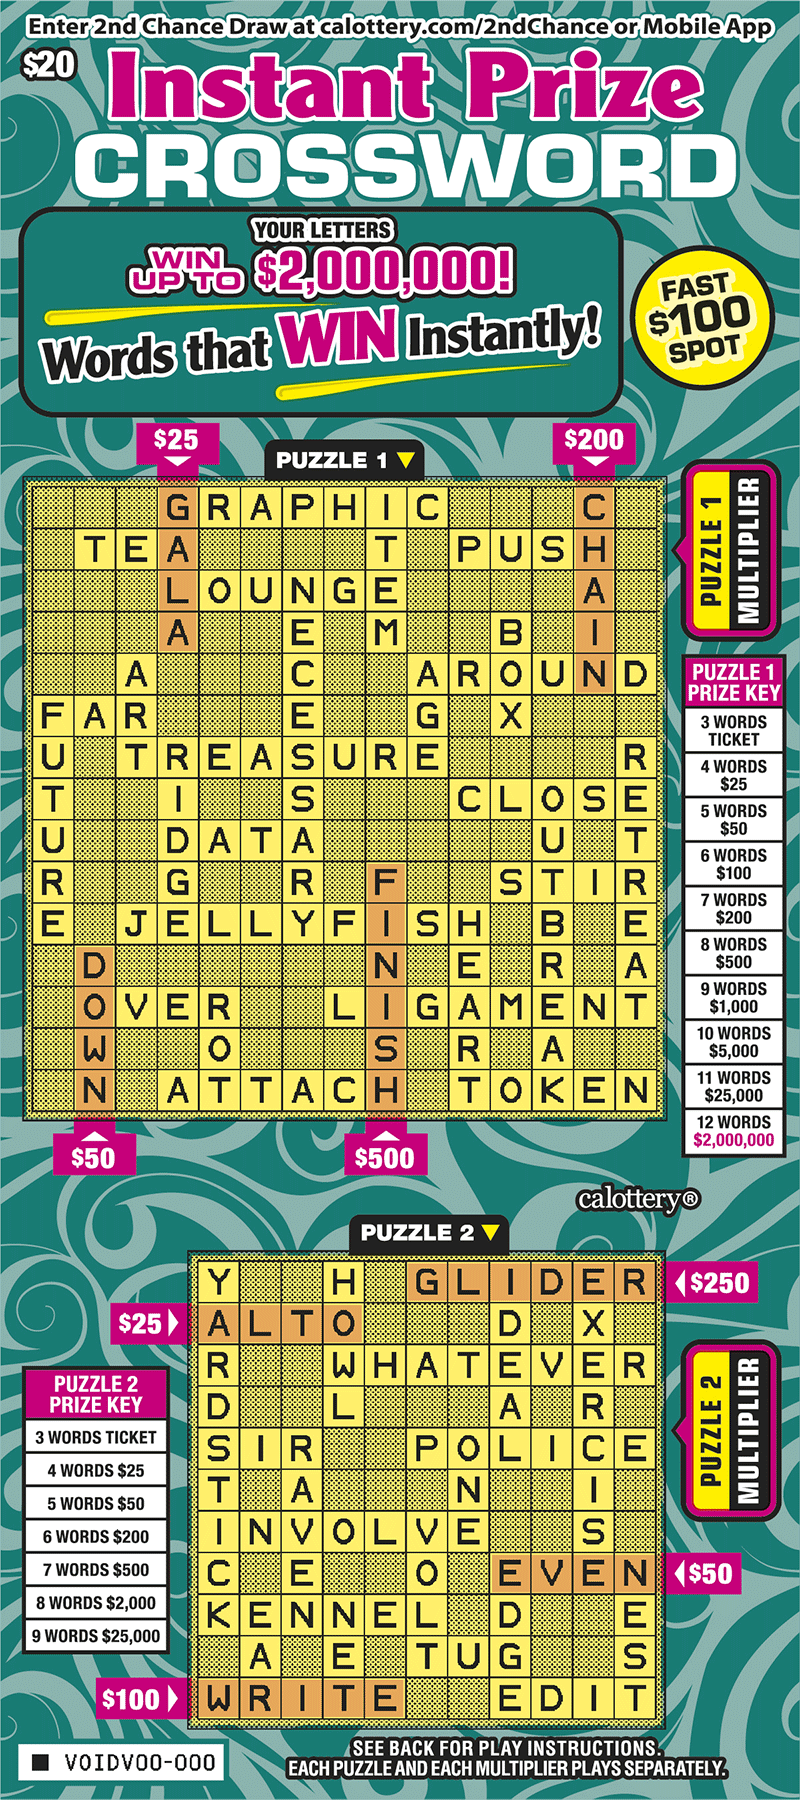
Instant Prize Crossword
Current Odds
1 in 3.26
+1.63%
Top Prize
$2,000,000
#17
$20
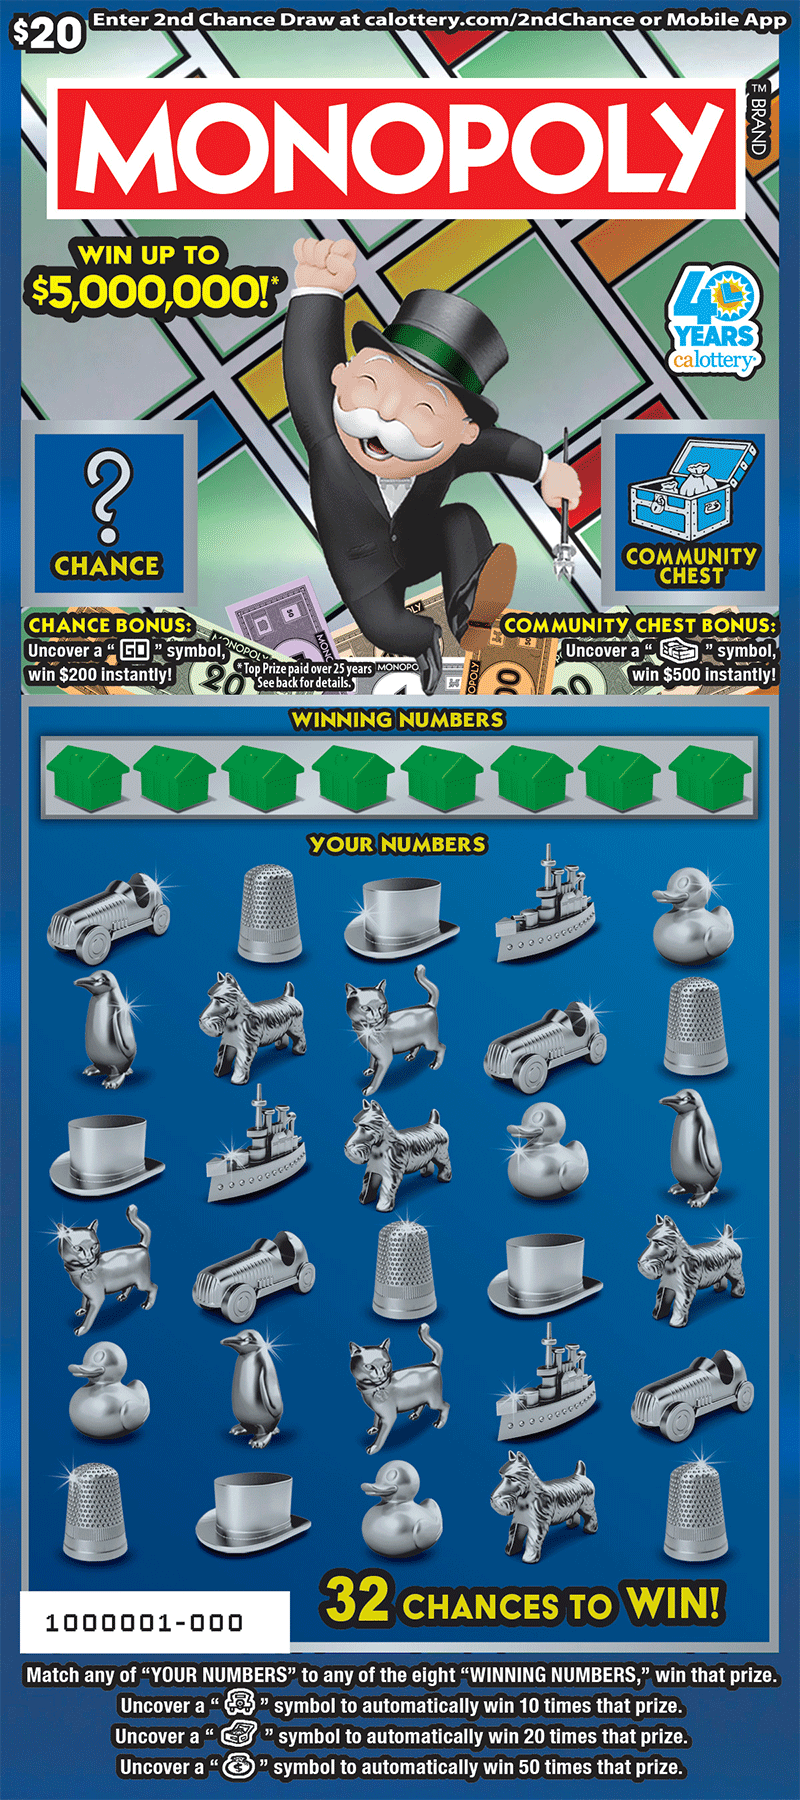
MONOPOLY
Current Odds
1 in 3.35
-1.08%
Top Prize
$5,000,000
#18
$10
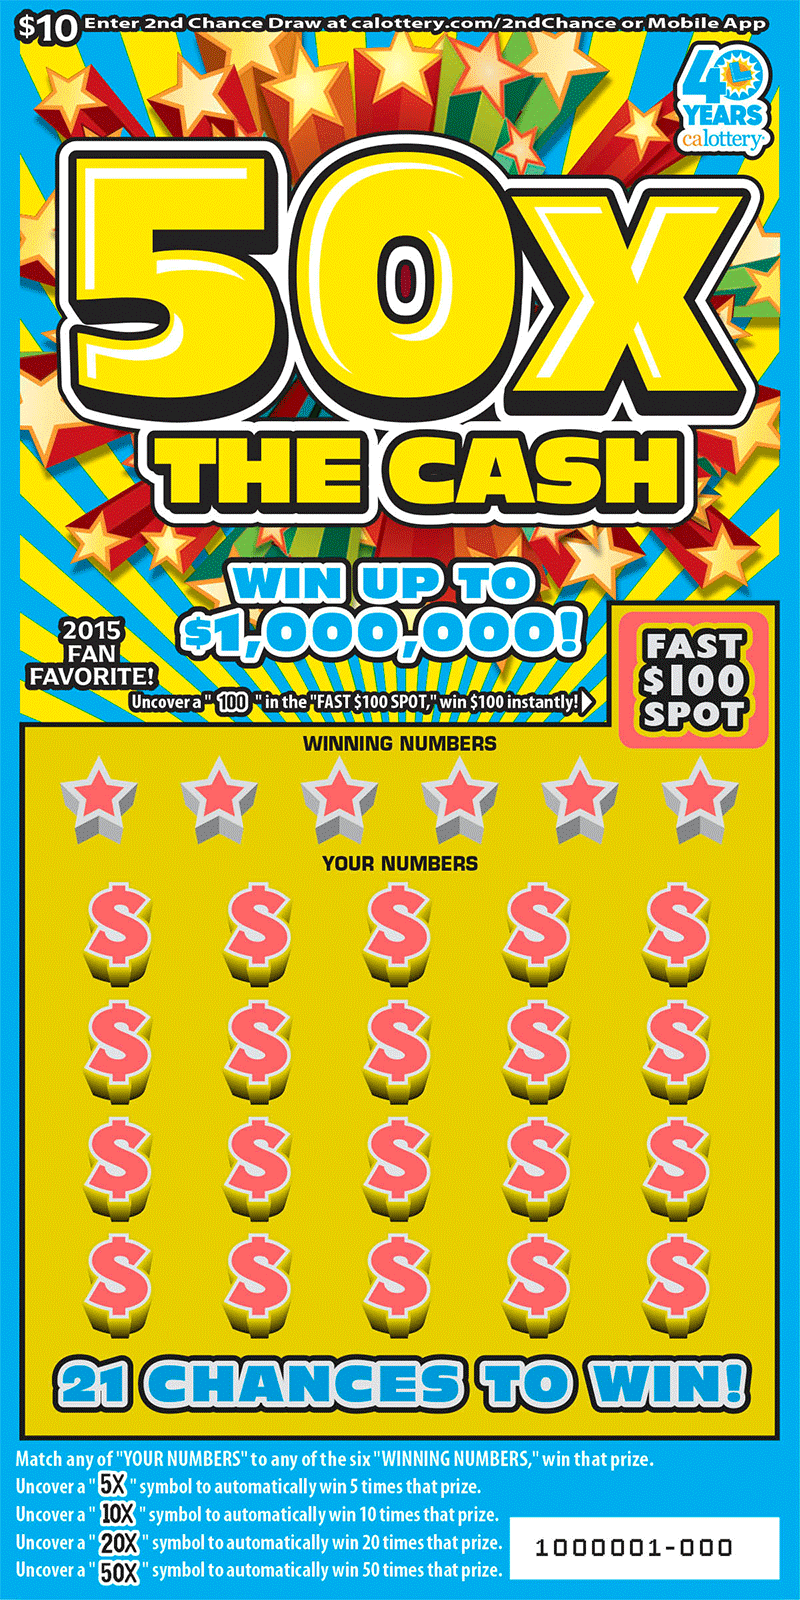
50X The Cash
Current Odds
1 in 3.37
+1.71%
Top Prize
$1,000,000
#19
$10
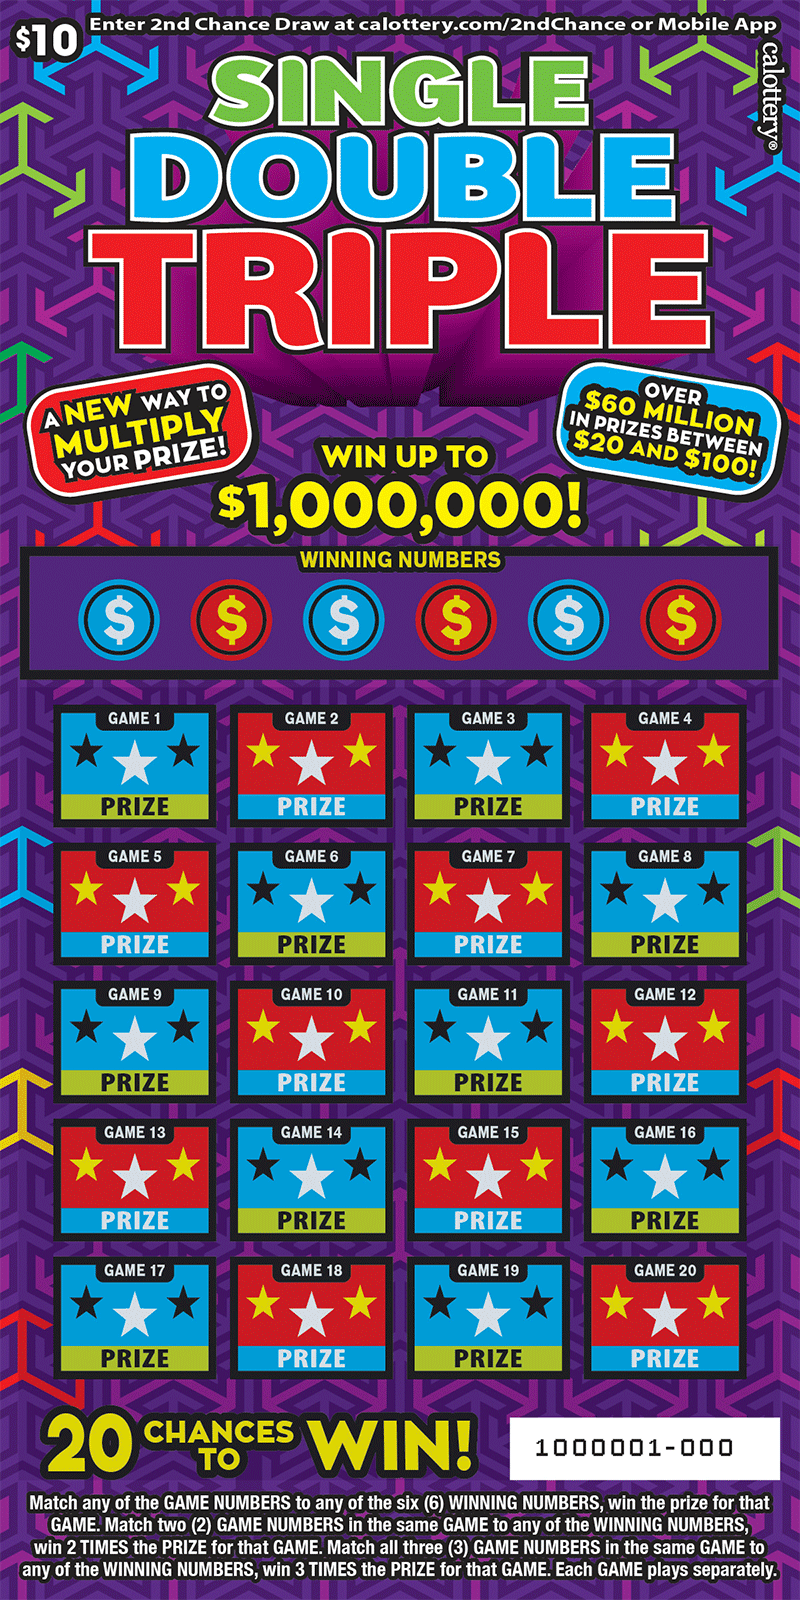
Single Double Triple
Current Odds
1 in 3.42
-0.10%
Top Prize
$1,000,000
#20
$10
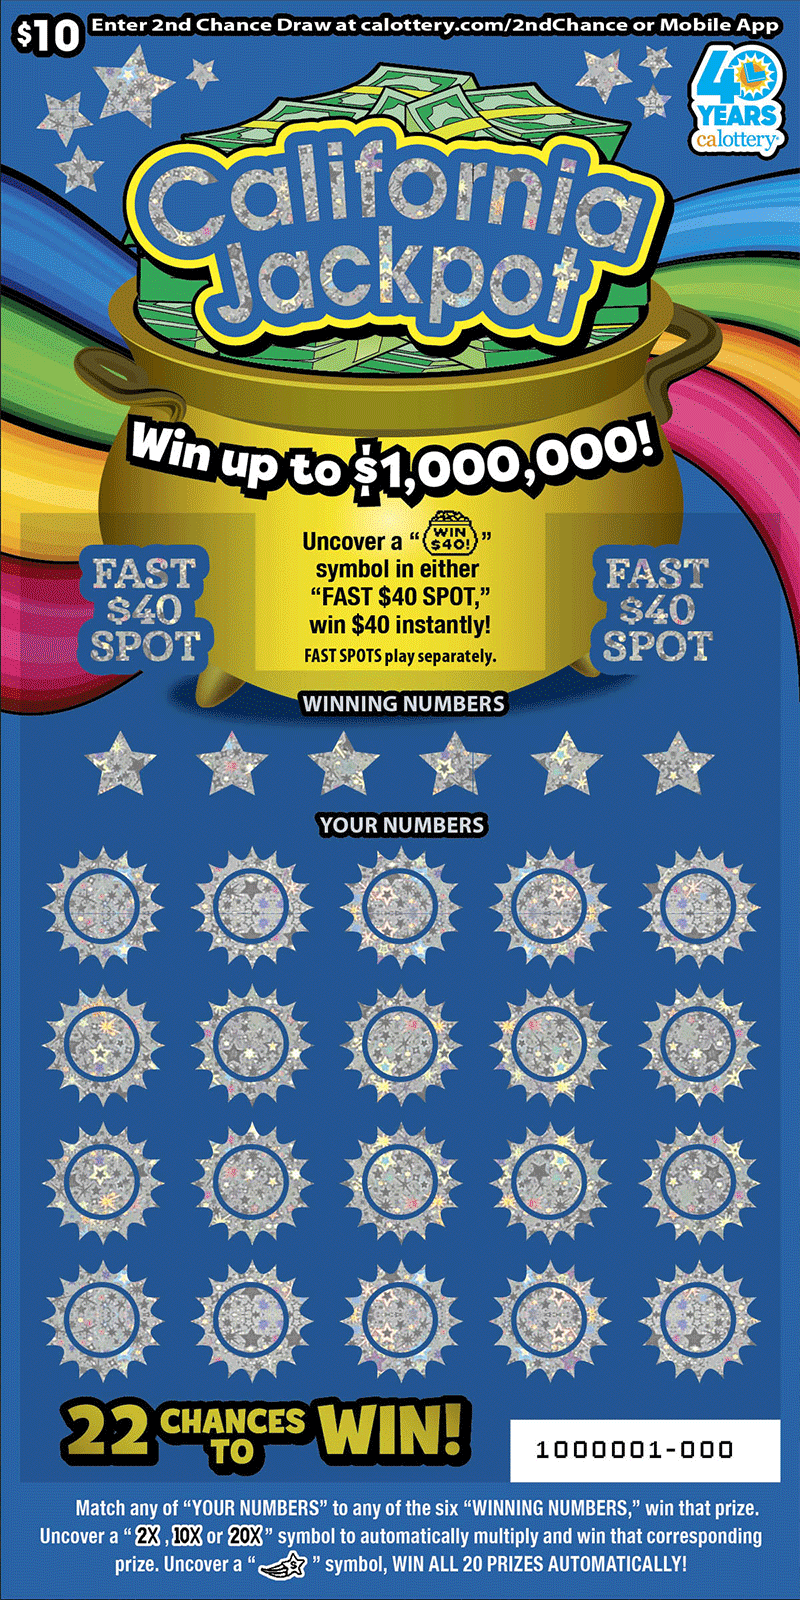
California Jackpot
Current Odds
1 in 3.45
-0.87%
Top Prize
$1,000,000
#21
$20
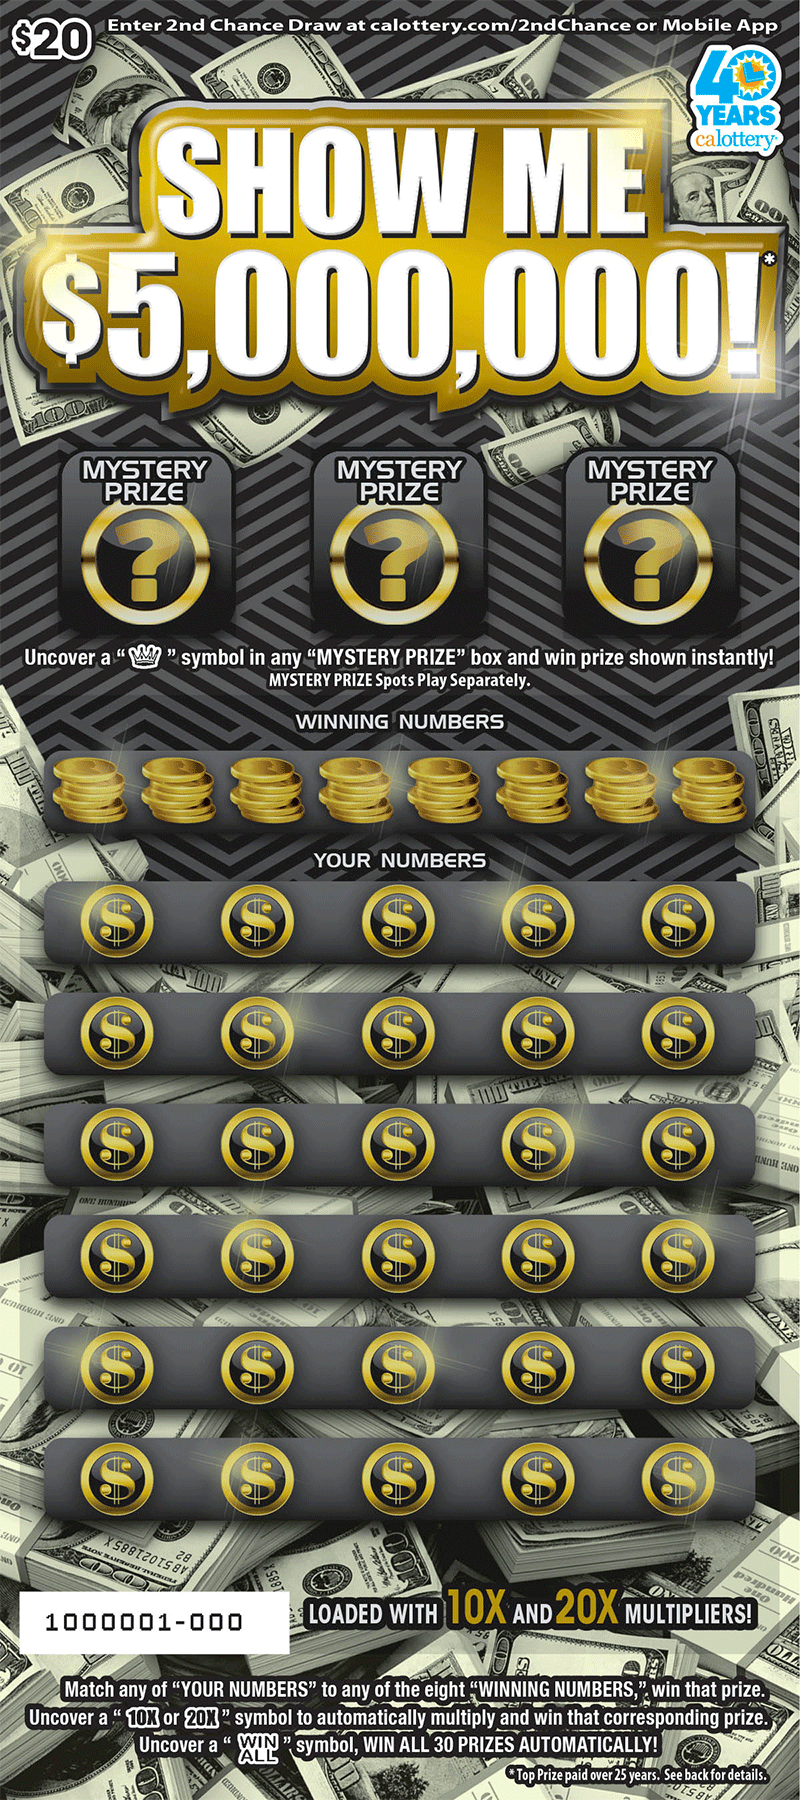
Show Me $5,000,000!
Current Odds
1 in 3.45
-4.20%
Top Prize
$5,000,000
#22
$30
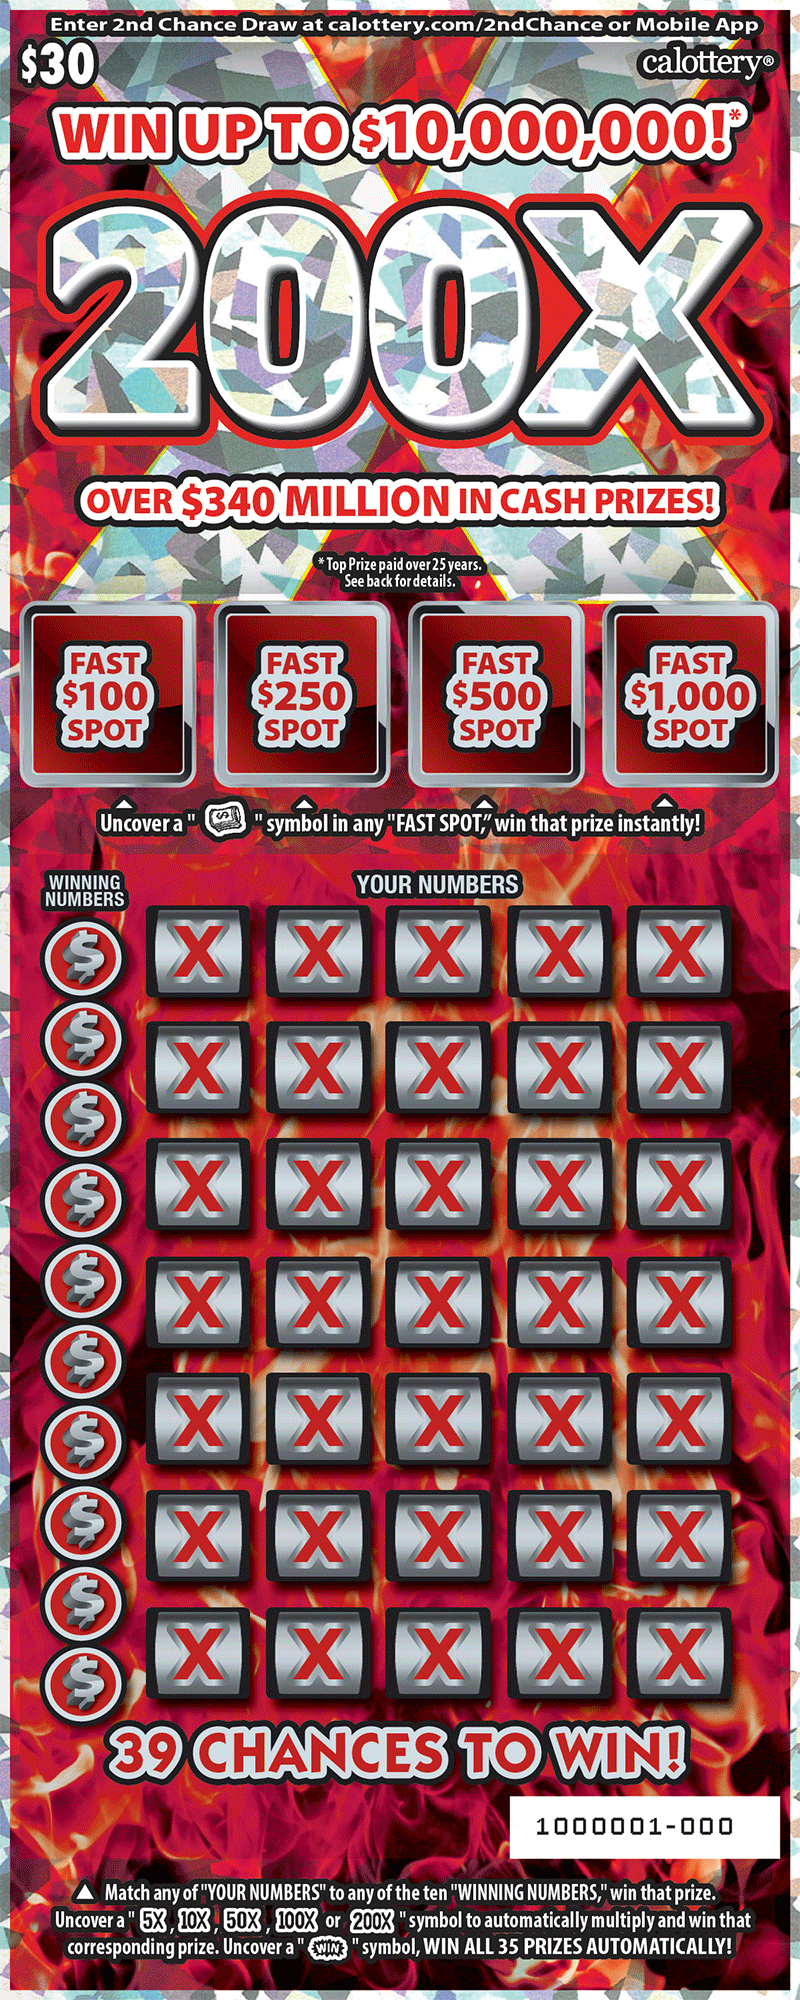
200X
Current Odds
1 in 3.47
-27.72%
Top Prize
$10,000,000
#23
$10
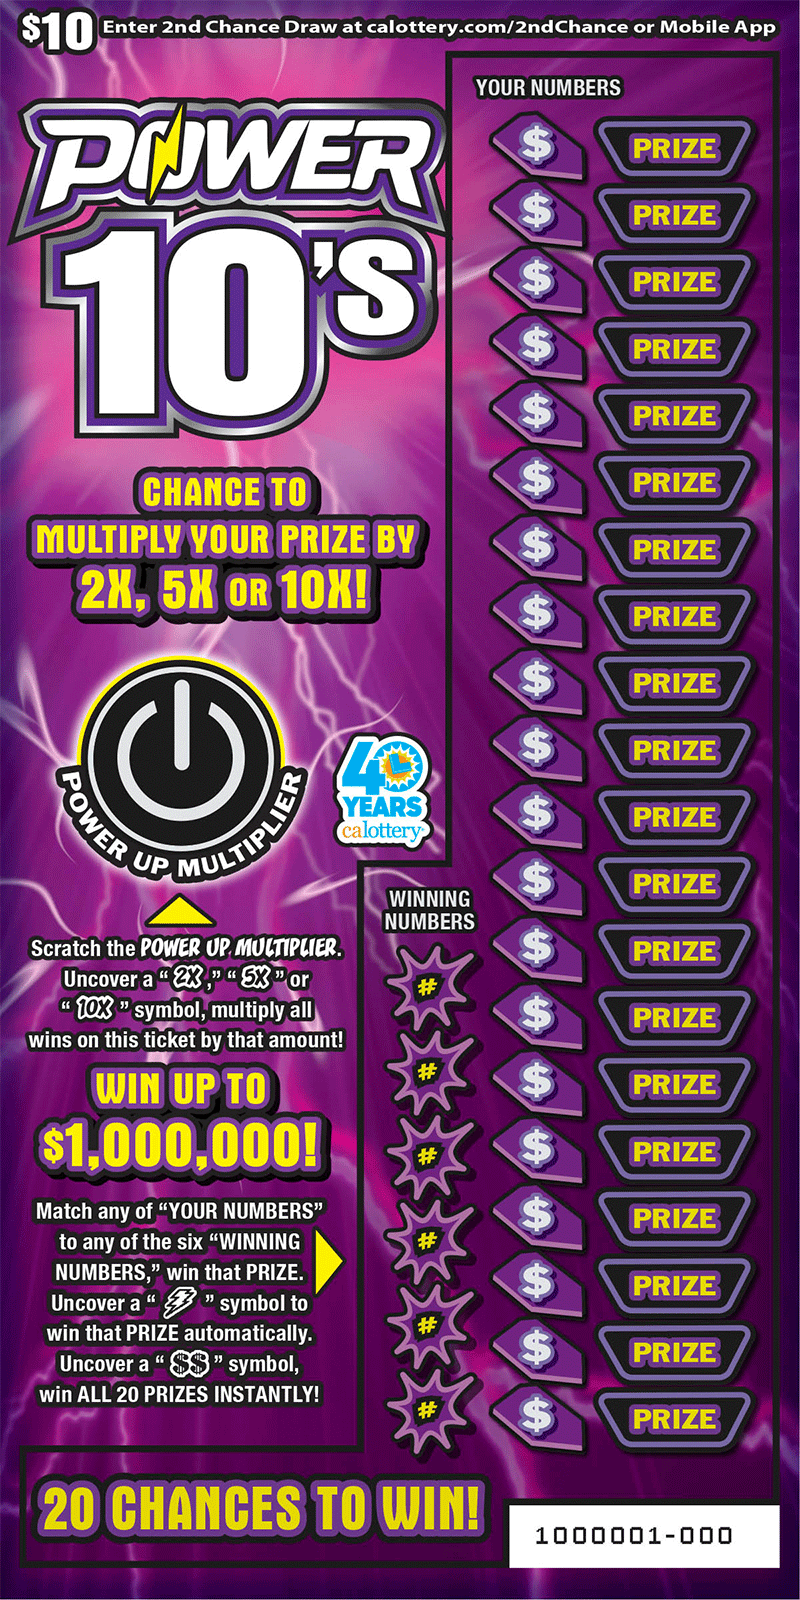
Power 10's
Current Odds
1 in 3.48
-7.77%
Top Prize
$1,000,000
#24
$5
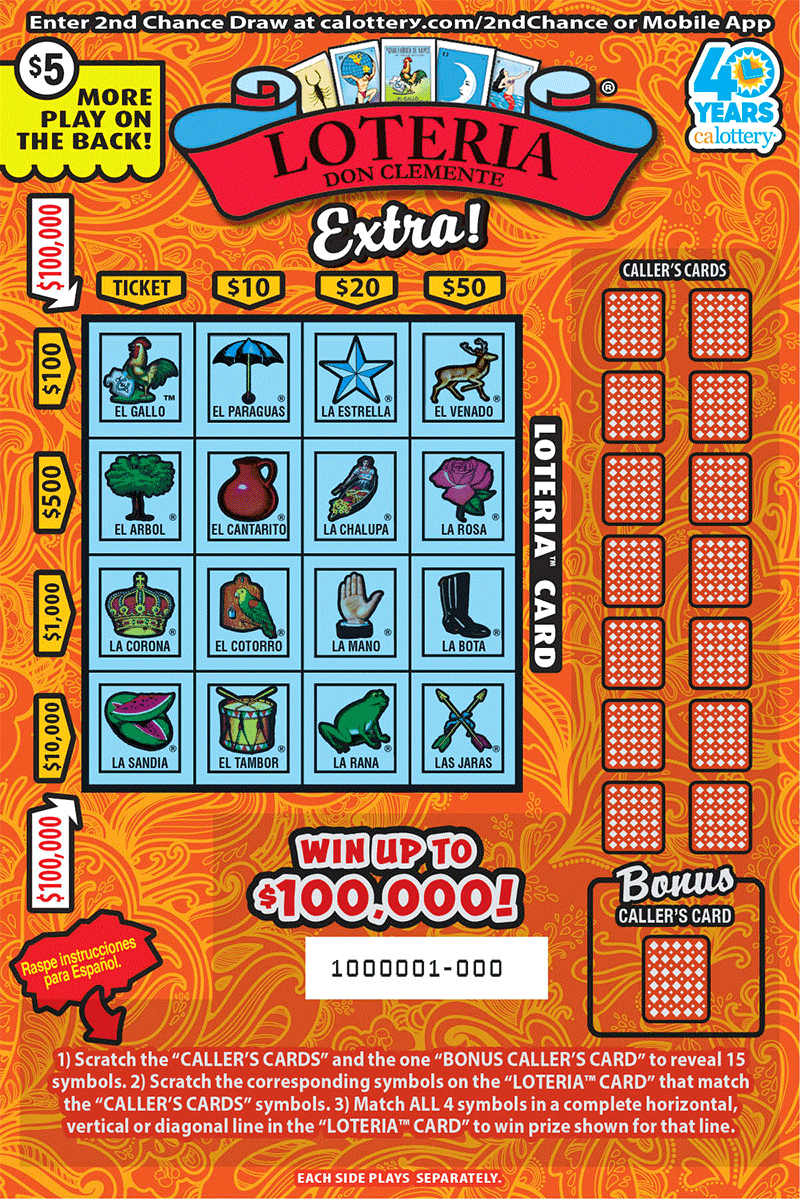
LOTERIA™ Extra!
Current Odds
1 in 3.51
-0.07%
Top Prize
$100,000
#25
$5
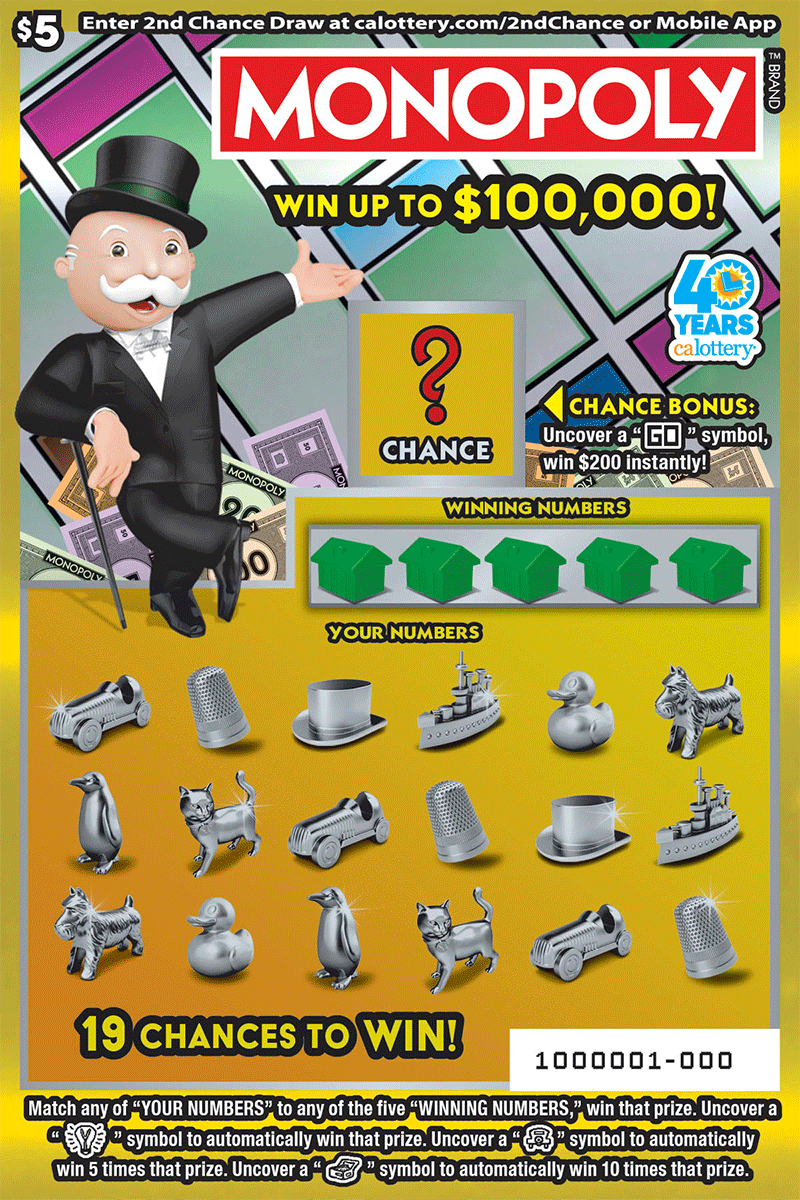
MONOPOLY
Current Odds
1 in 3.51
-0.79%
Top Prize
$100,000
#26
$3
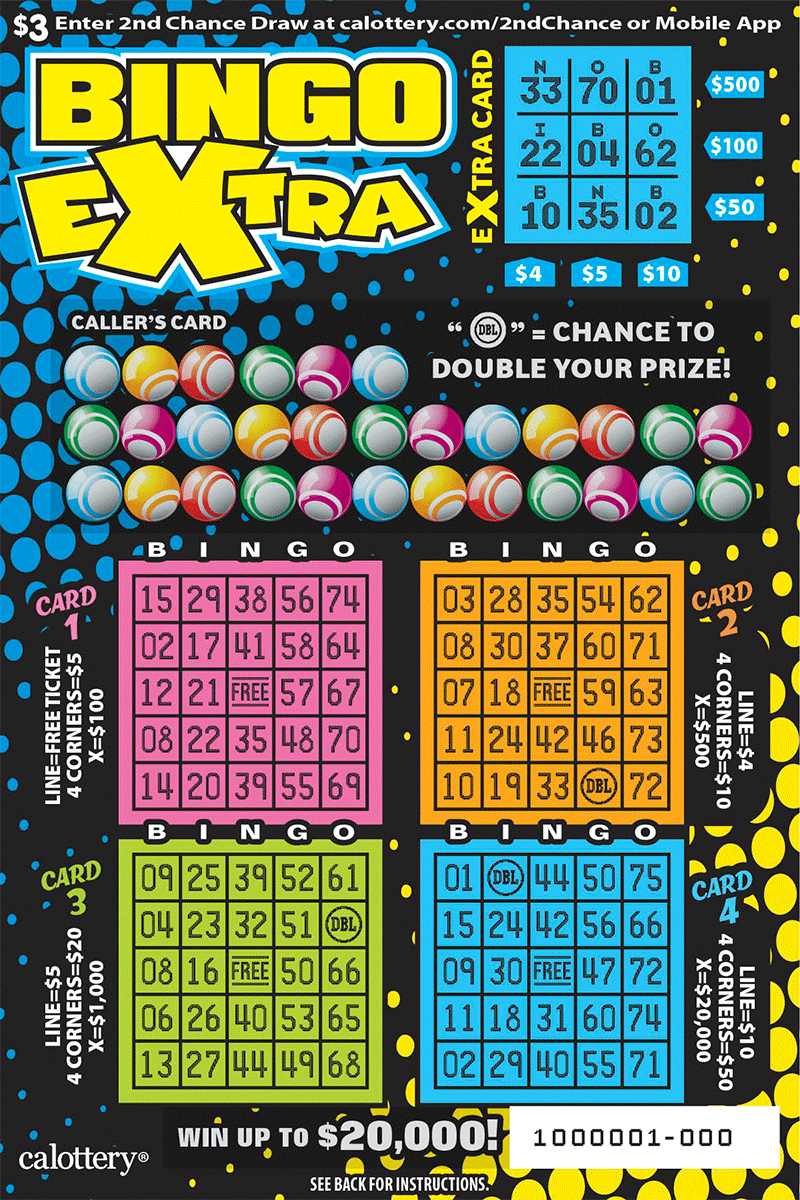
Bingo Extra
Current Odds
1 in 3.53
-1.89%
Top Prize
$20,000
#27
$20
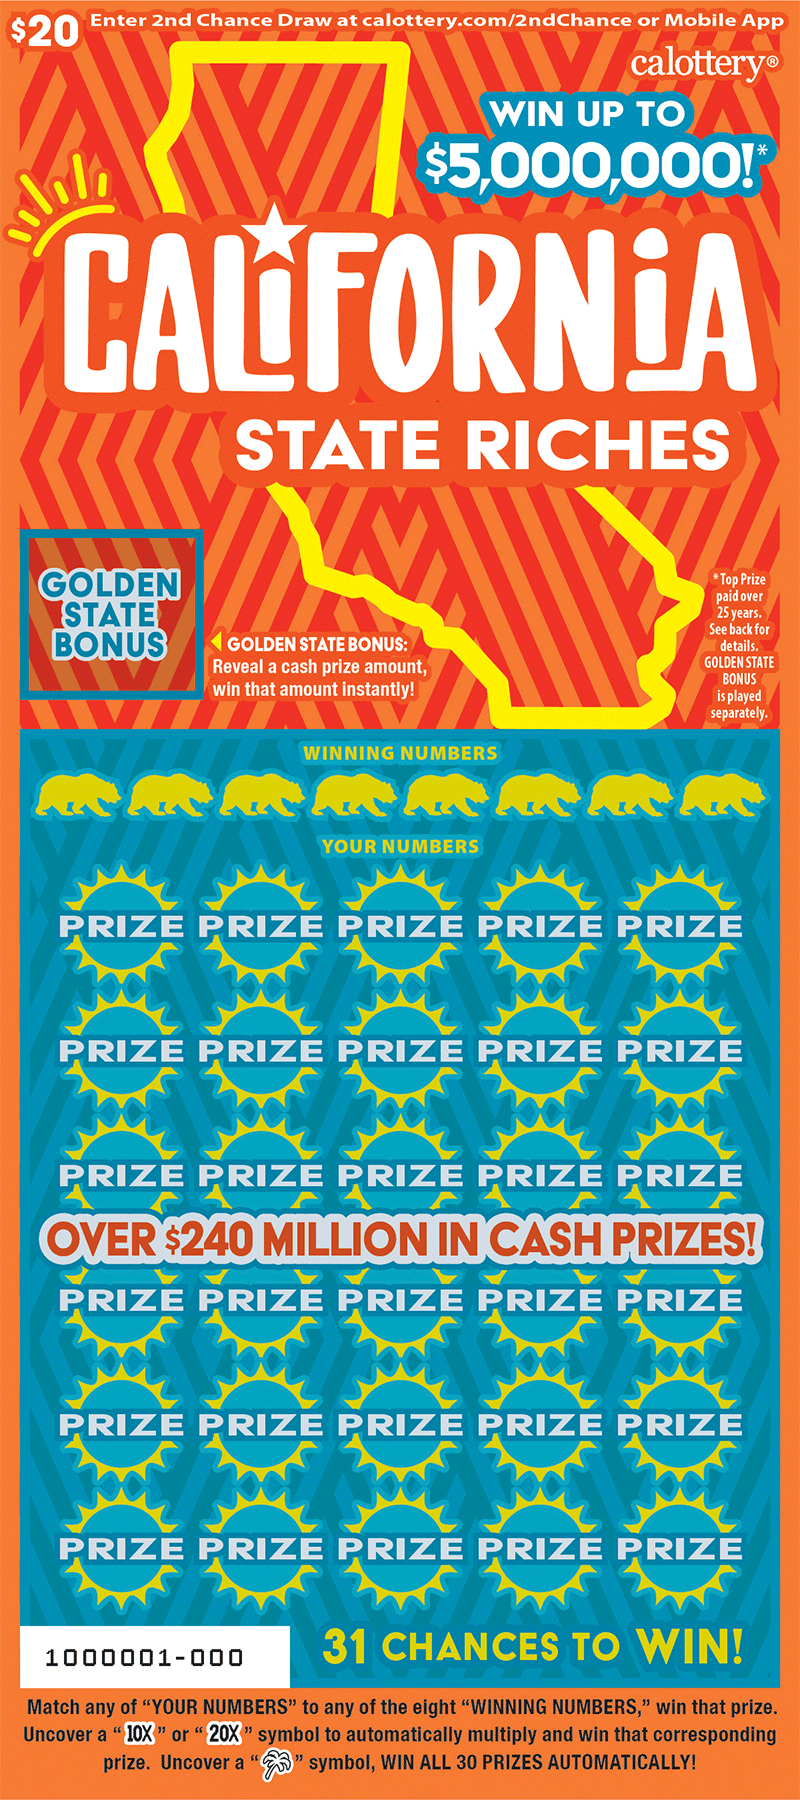
California State Riches
Current Odds
1 in 3.53
-6.53%
Top Prize
$5,000,000
#28
$10

San Francisco 49ers
Current Odds
1 in 3.55
-3.51%
Top Prize
$1,000,000
#29
$10
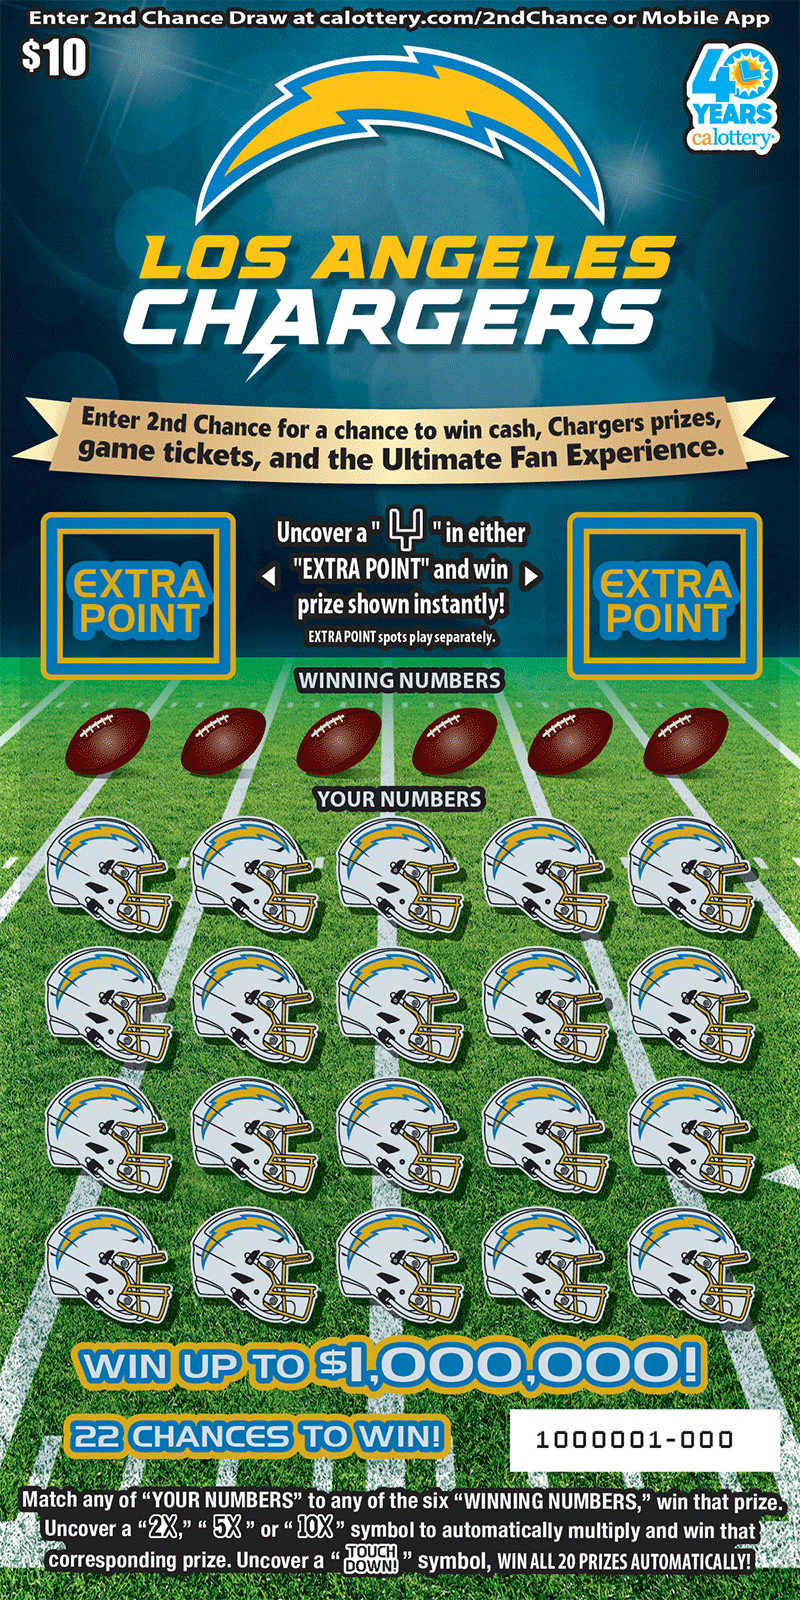
Los Angeles Chargers
Current Odds
1 in 3.57
-4.19%
Top Prize
$1,000,000
#30
$3
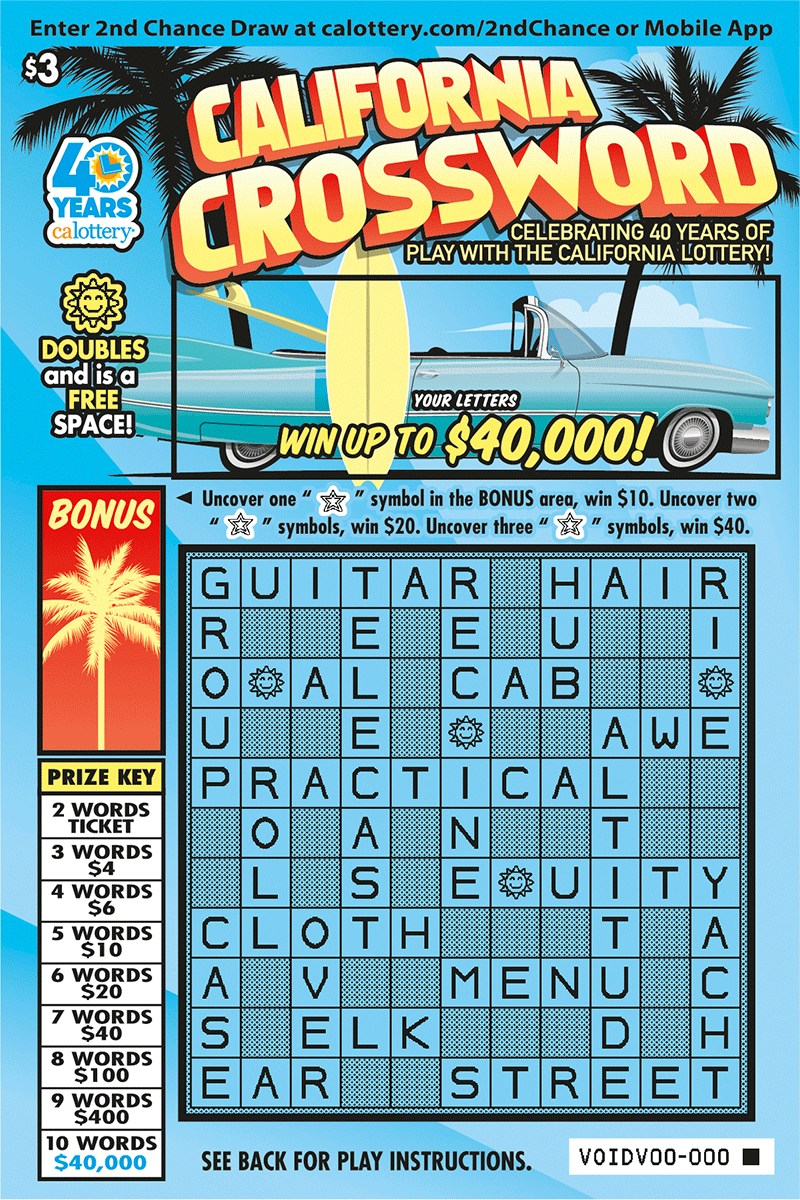
California Crossword
Current Odds
1 in 3.59
+1.48%
Top Prize
$40,000
#31
$10
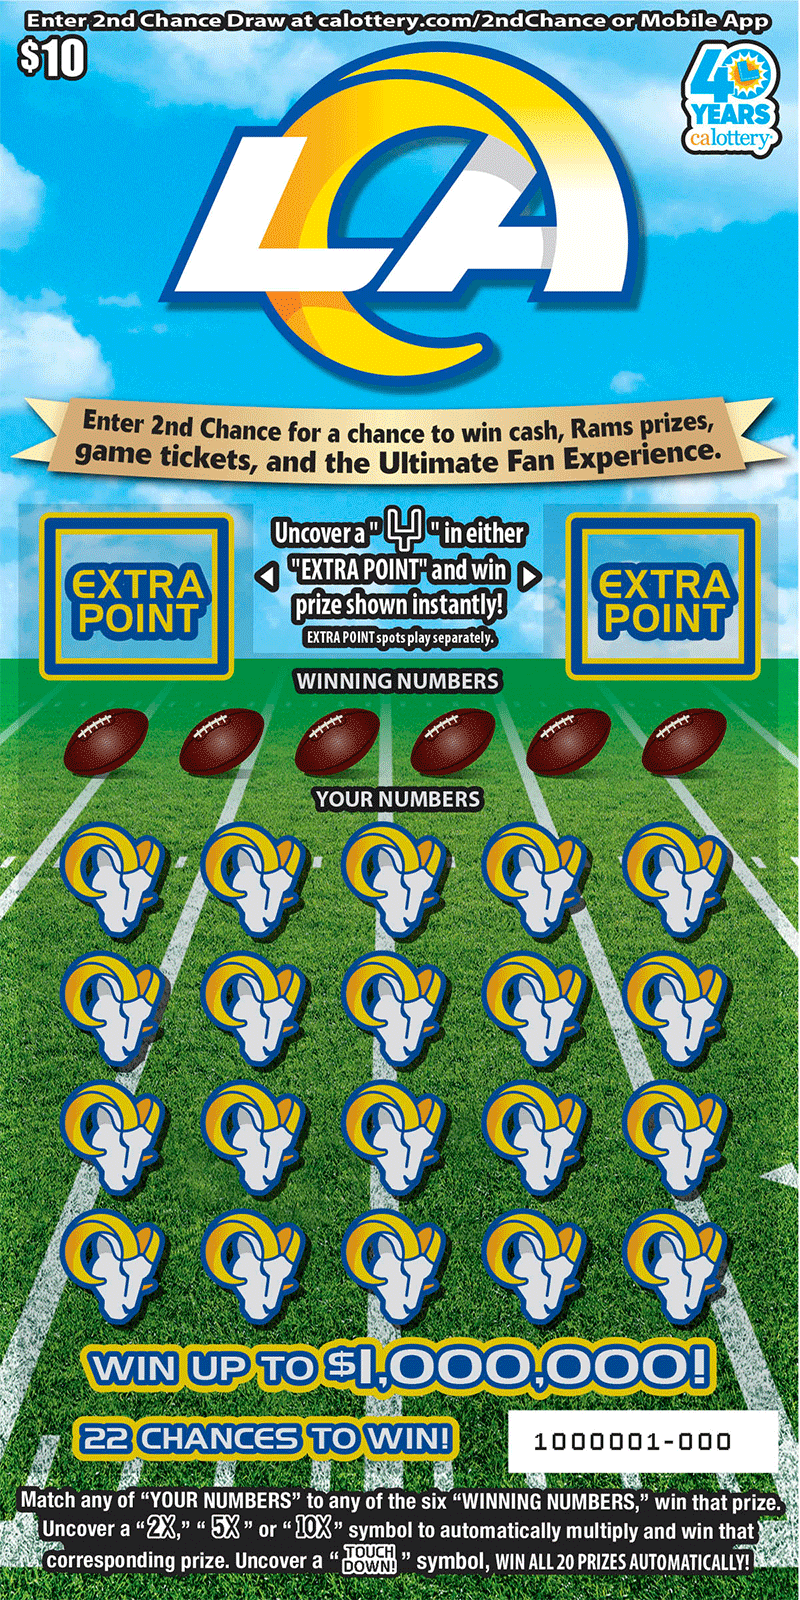
Los Angeles Rams
Current Odds
1 in 3.59
-4.81%
Top Prize
$1,000,000
#32
$1
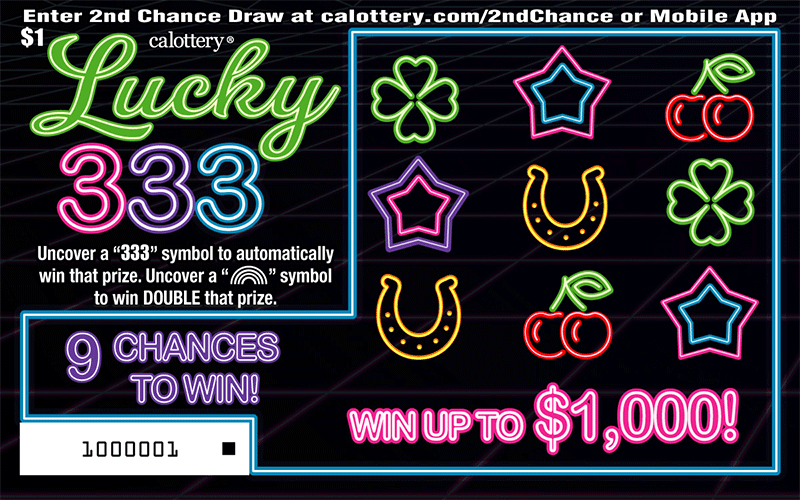
Lucky 333
Current Odds
1 in 3.6
+15.88%
Top Prize
$1,000
#33
$5
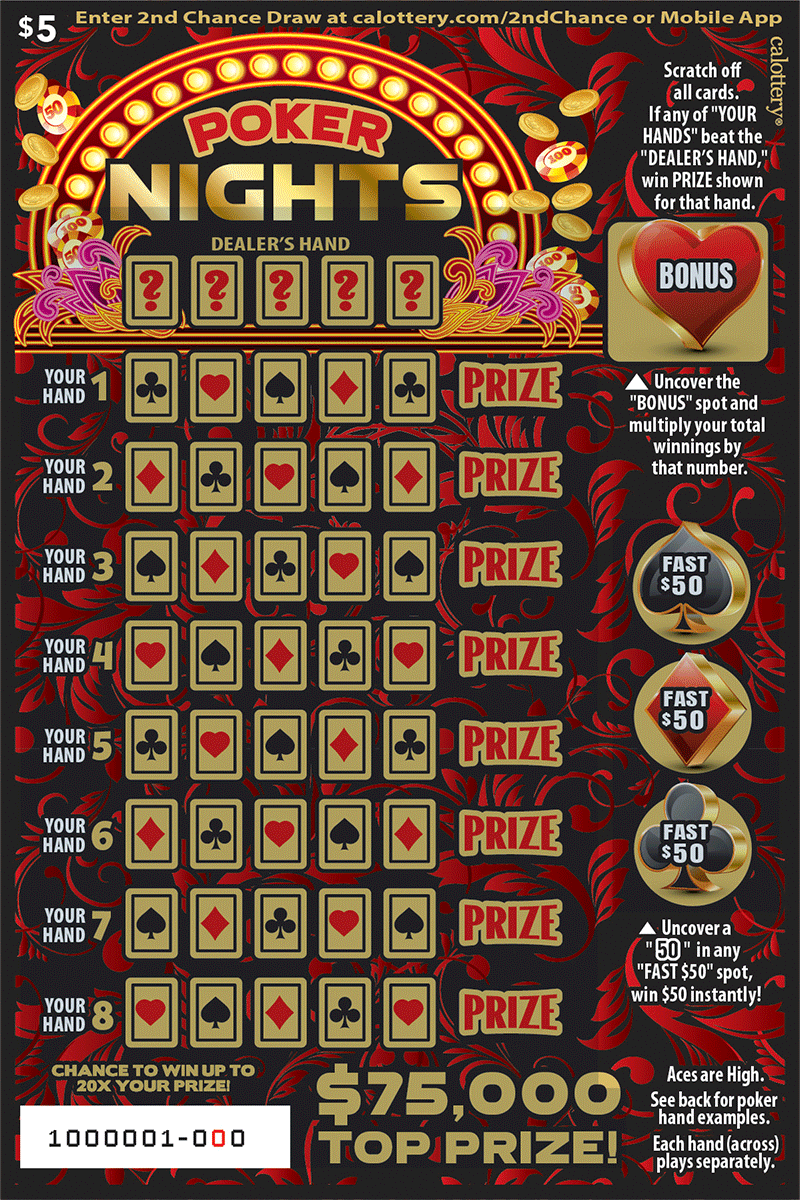
Poker Nights
Current Odds
1 in 3.63
-4.12%
Top Prize
$75,000
#34
$10
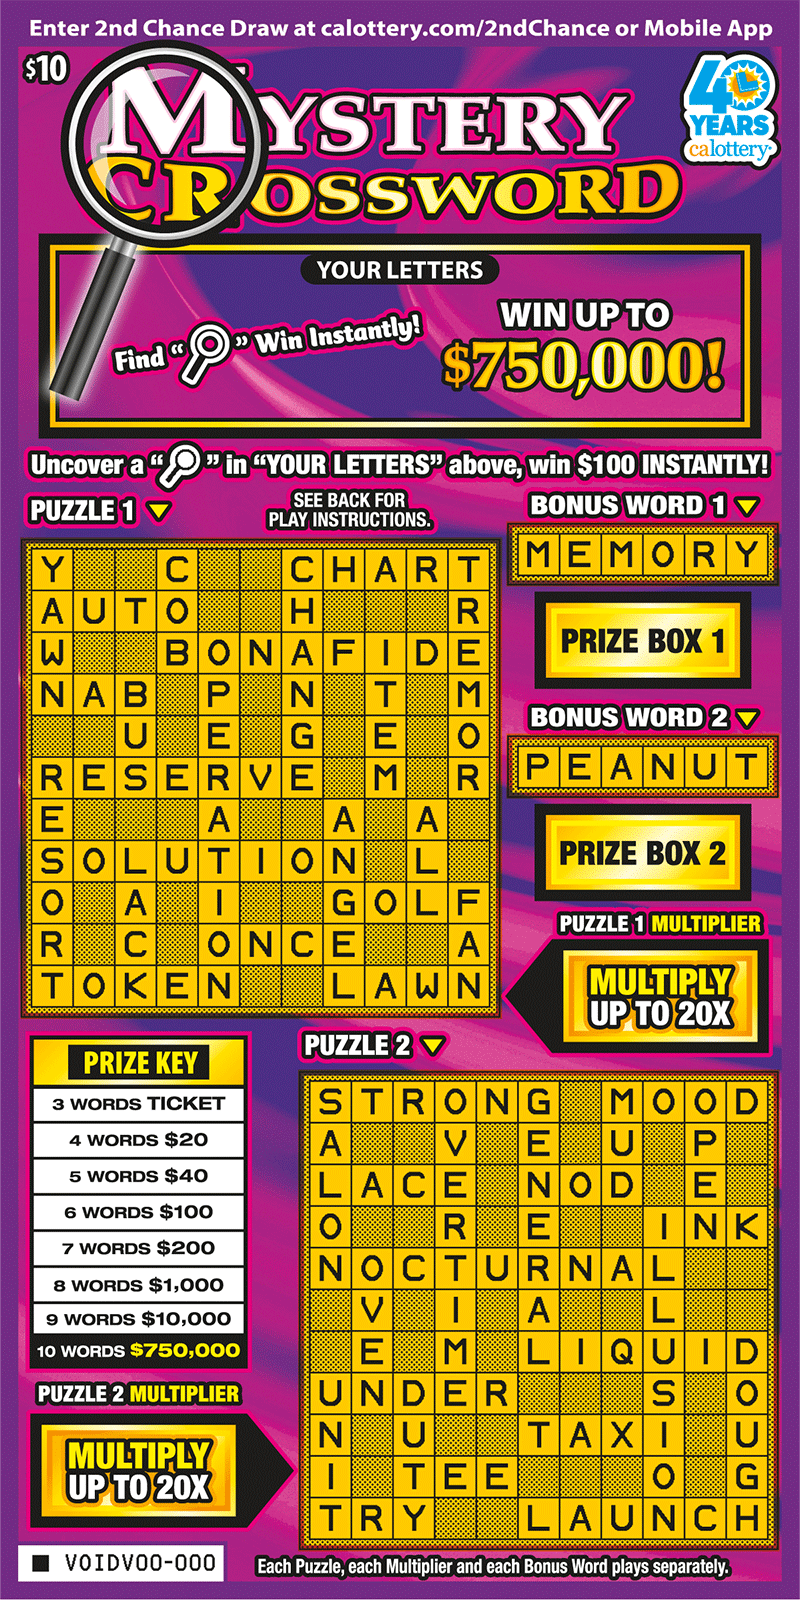
Mystery Crossword
Current Odds
1 in 3.65
-9.61%
Top Prize
$750,000
#35
$3
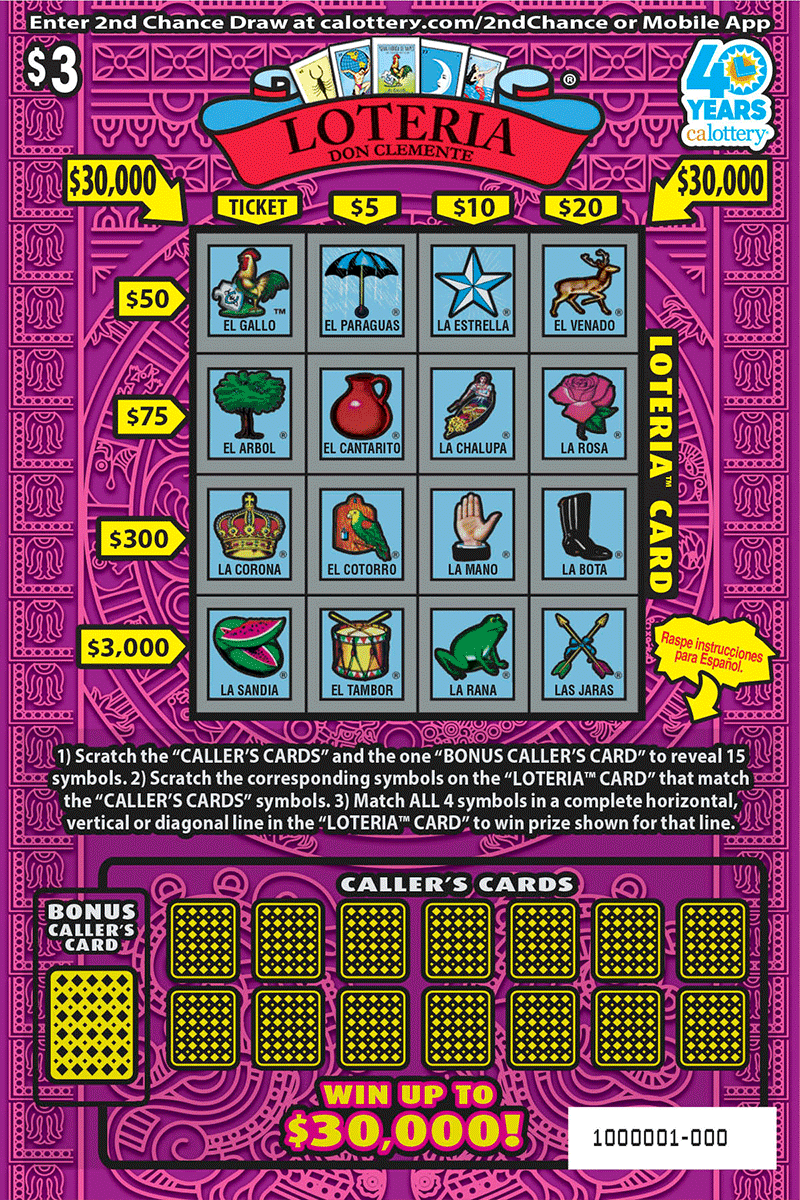
LOTERIA™
Current Odds
1 in 3.65
+2.56%
Top Prize
$30,000
#36
$5
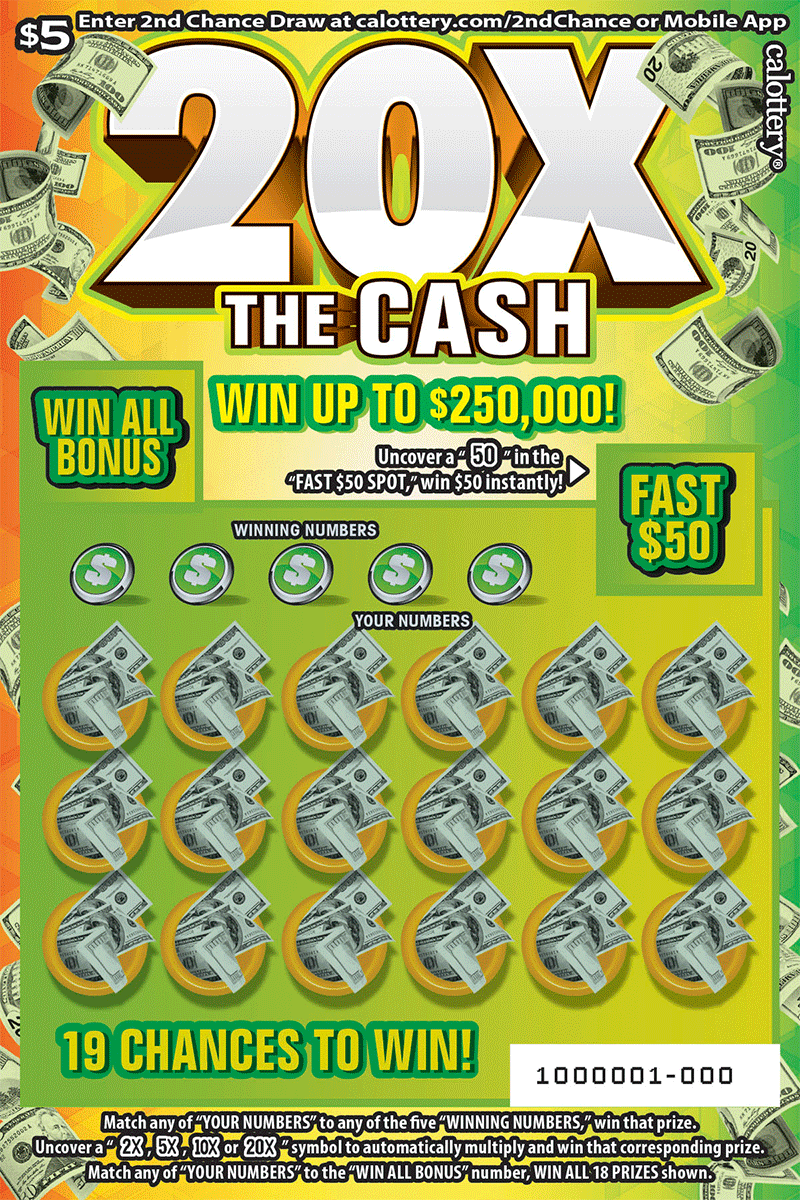
20X The Cash
Current Odds
1 in 3.65
+0.53%
Top Prize
$250,000
#37
$3
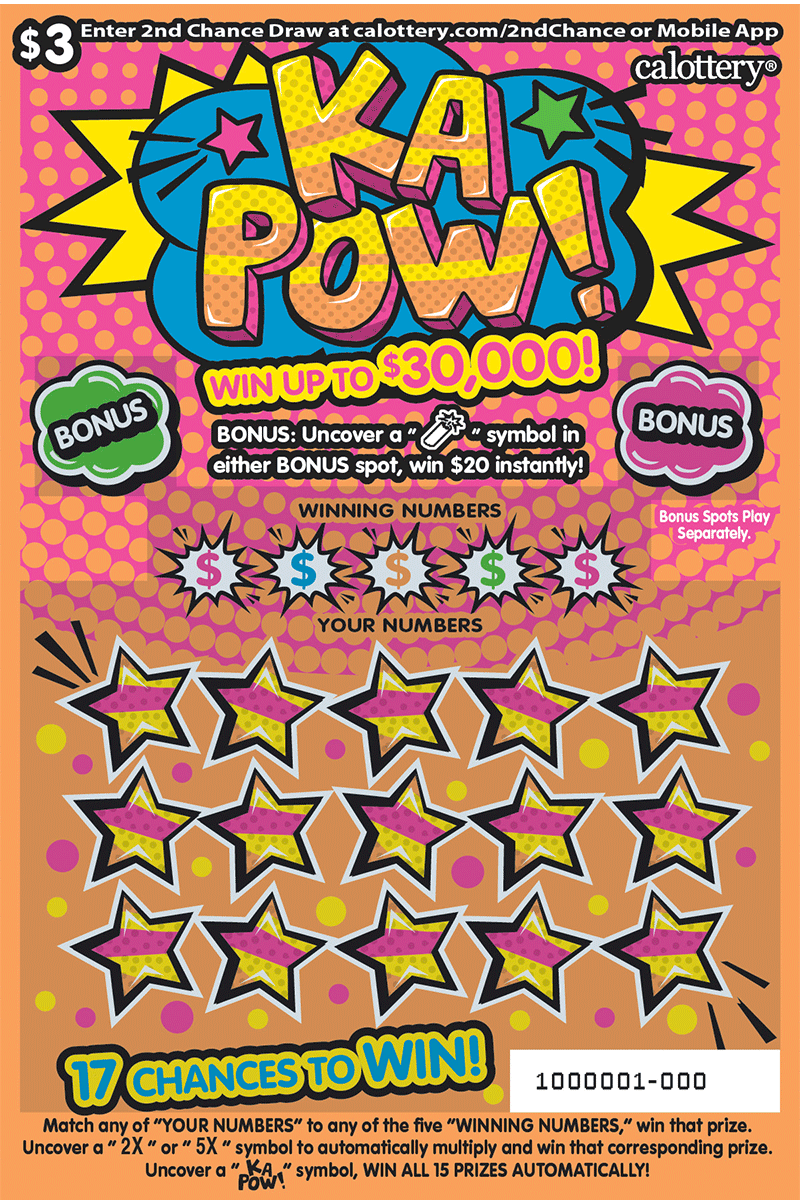
KA POW
Current Odds
1 in 3.67
+2.12%
Top Prize
$30,000
#38
$5
MEGA Crossword
Current Odds
1 in 3.69
-0.13%
Top Prize
$75,000
#39
$5
Hot Spot Multiplier
Current Odds
1 in 3.69
+0.61%
Top Prize
$500,000
#40
$5
Tic Tac Toe Bonus
Current Odds
1 in 3.7
-0.99%
Top Prize
$250,000
#41
$10
Joker's Wild Poker
Current Odds
1 in 3.71
-12.40%
Top Prize
$750,000
#42
$3
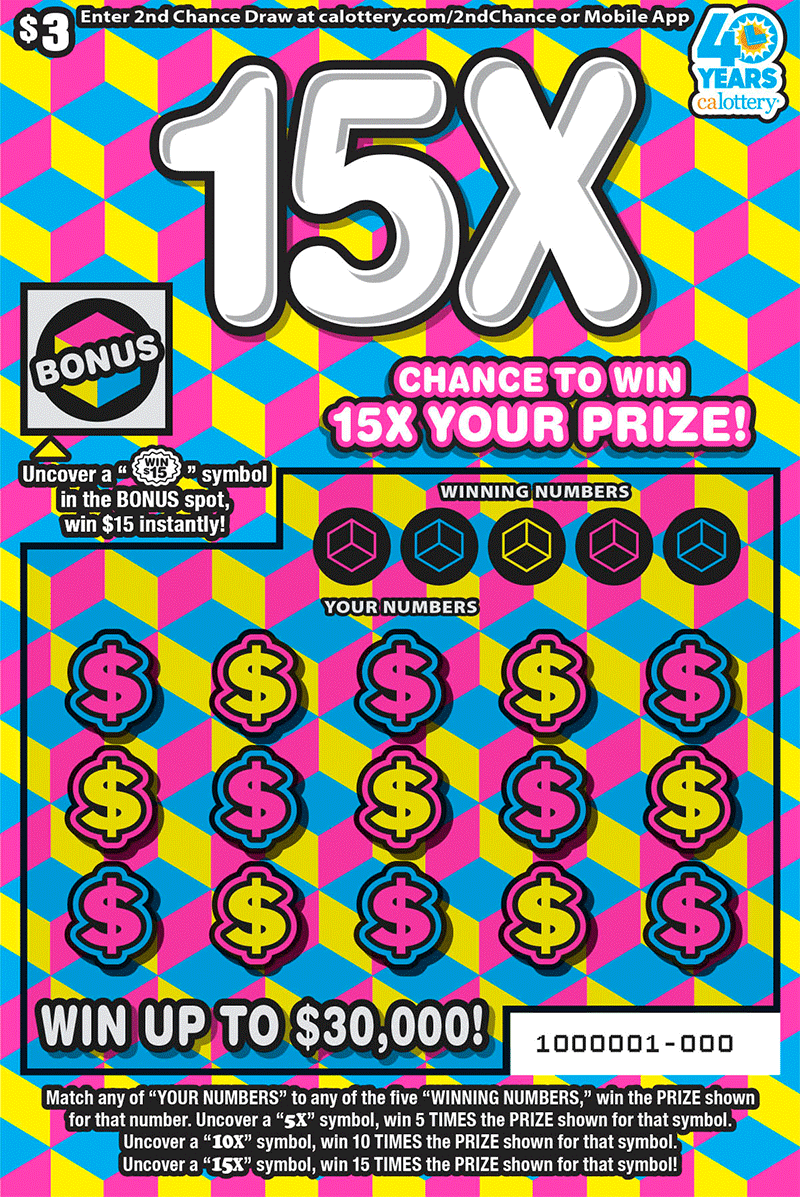
15X
Current Odds
1 in 3.79
-0.26%
Top Prize
$30,000
#43
$5
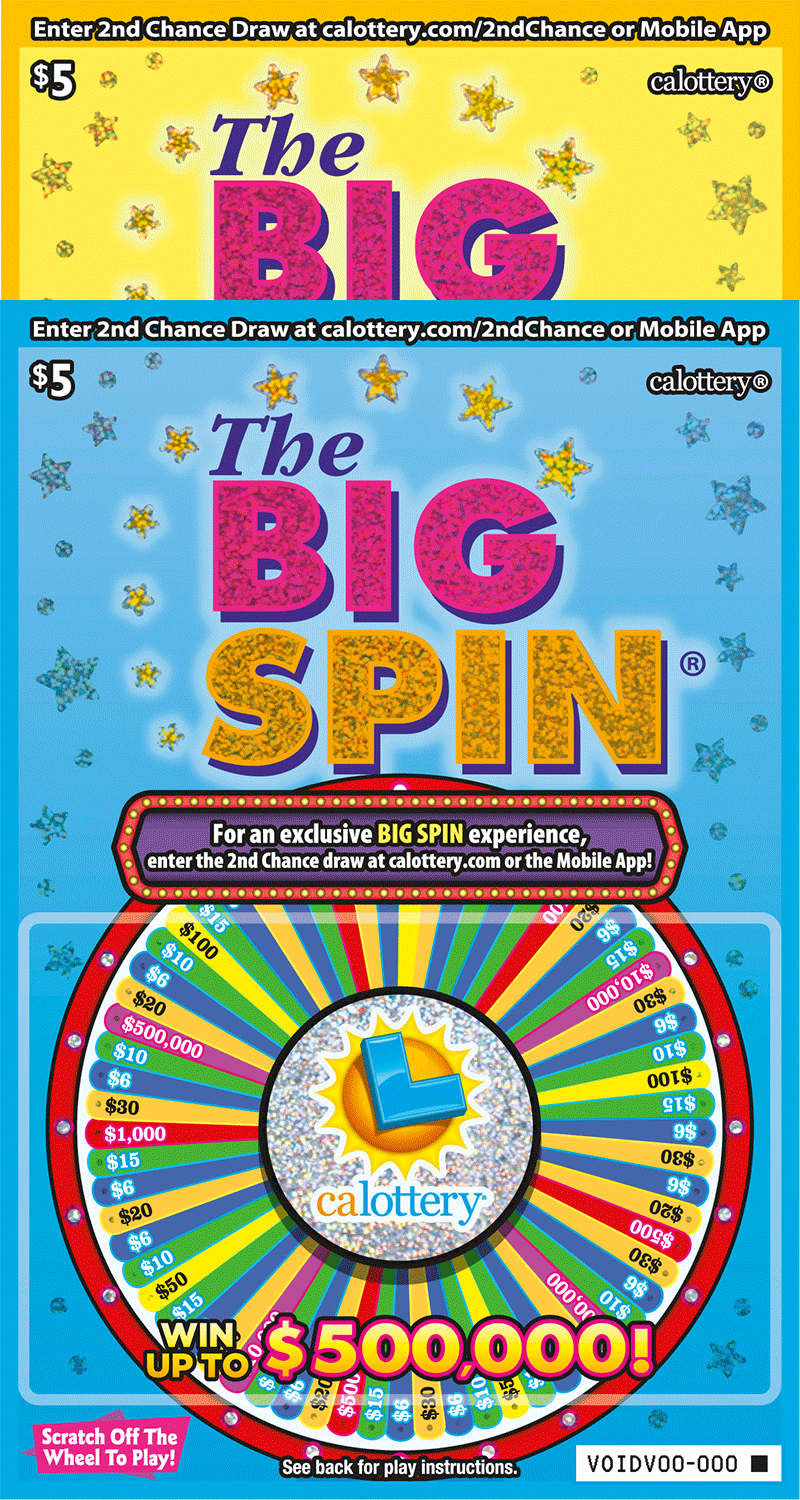
The Big Spin
Current Odds
1 in 3.8
-2.34%
Top Prize
$500,000
#44
$10
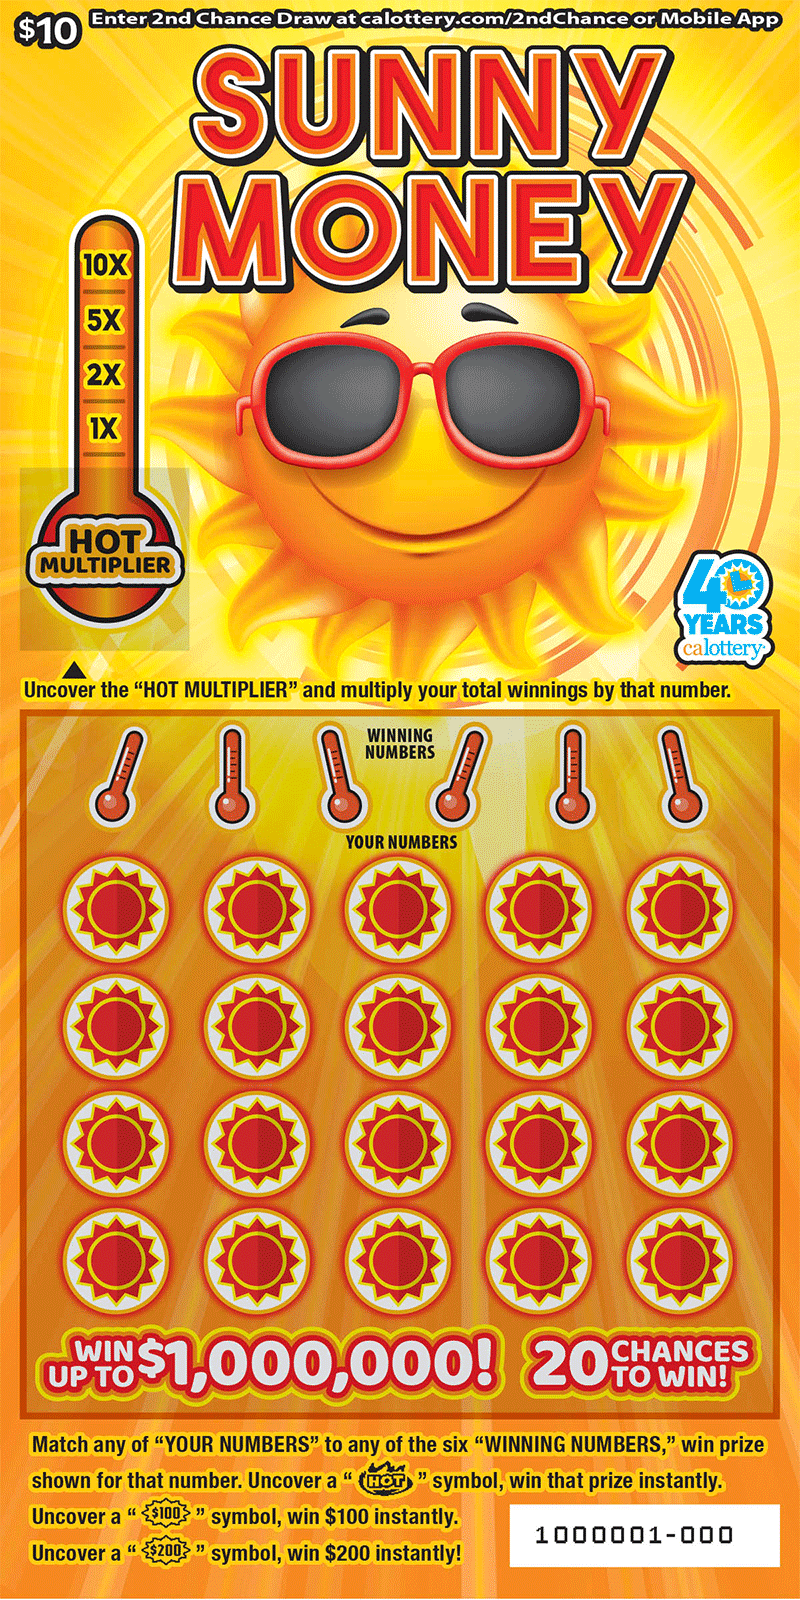
Sunny Money
Current Odds
1 in 3.81
-6.76%
Top Prize
$1,000,000
#45
$20
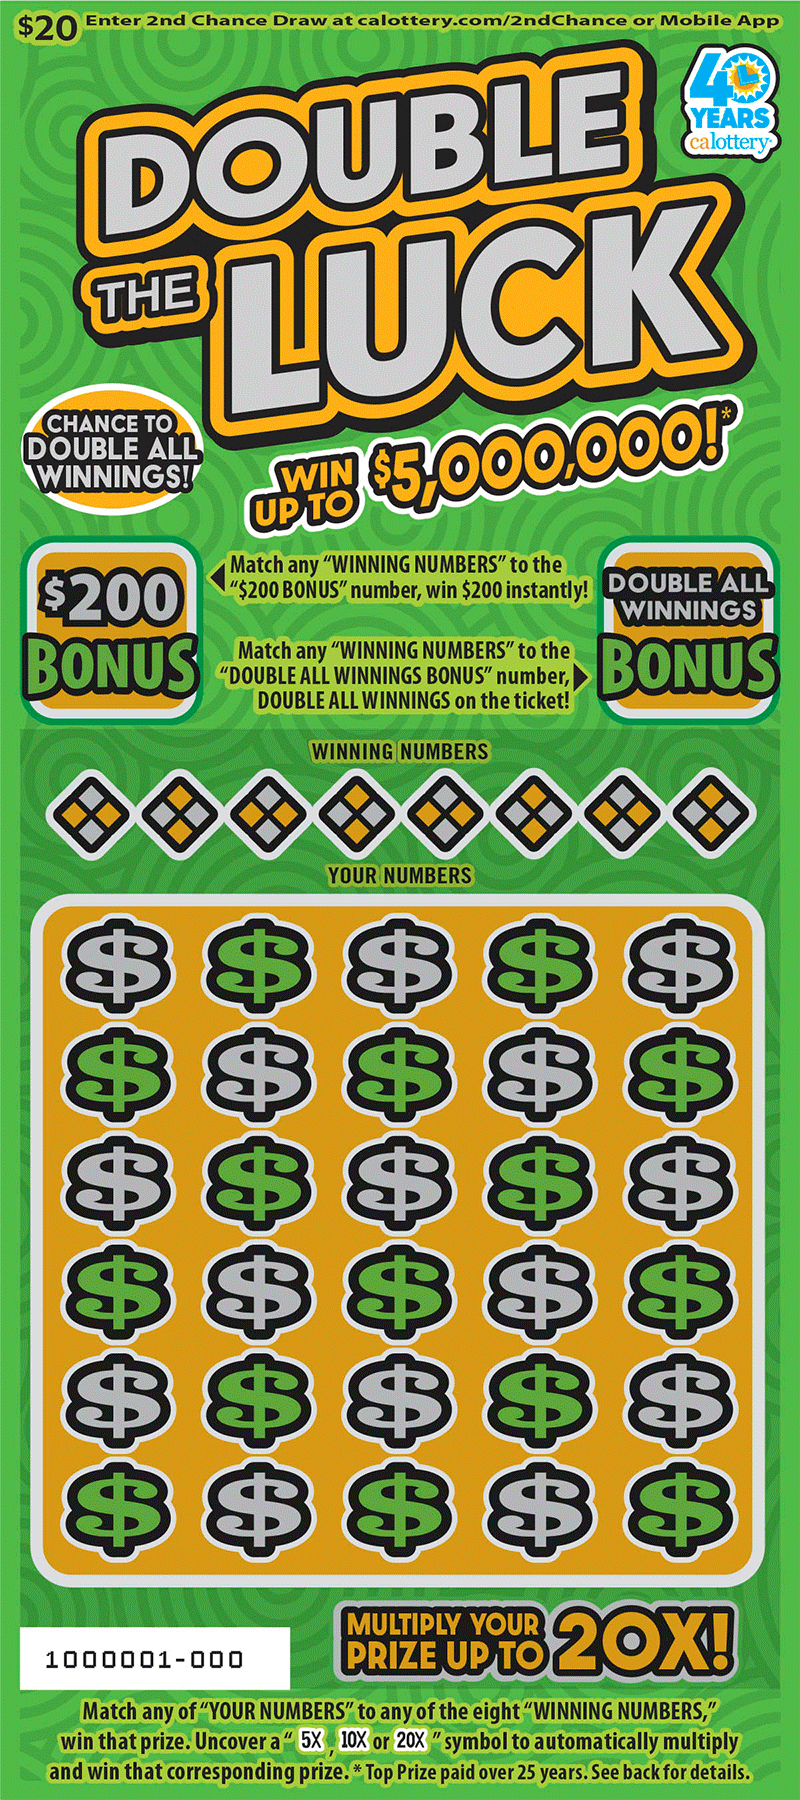
Double The Luck
Current Odds
1 in 3.82
-4.23%
Top Prize
$5,000,000
#46
$5
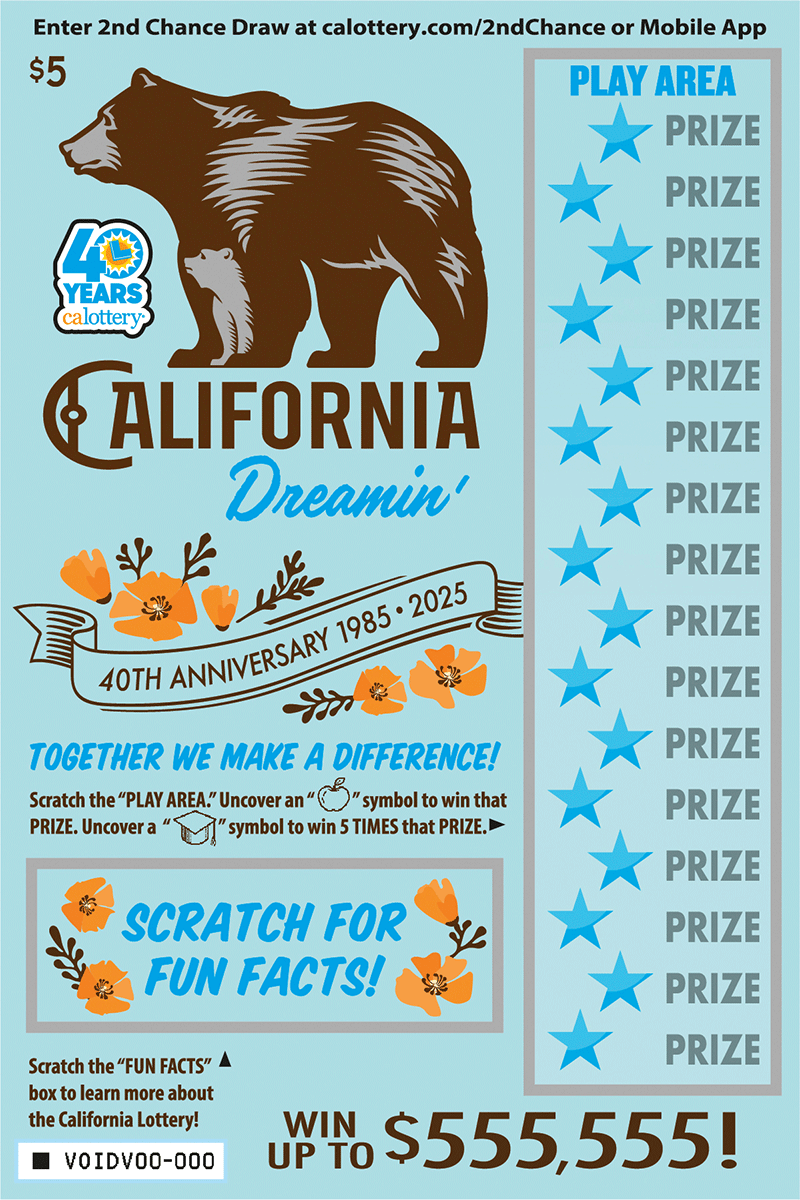
California Dreamin'
Current Odds
1 in 3.9
-3.86%
Top Prize
$555,555
#47
$2
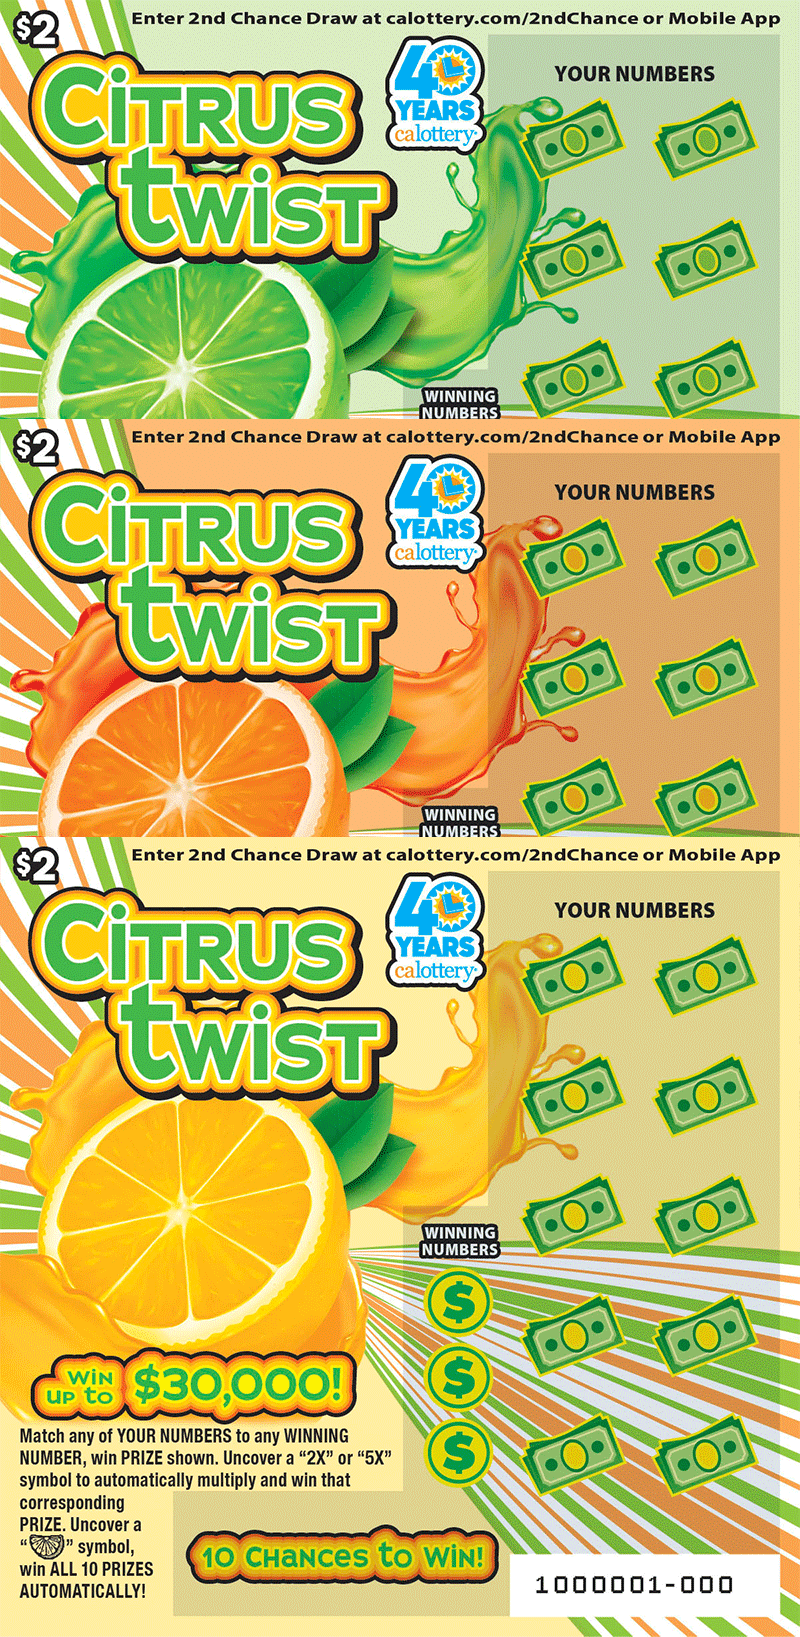
Citrus Twist
Current Odds
1 in 3.9
+4.86%
Top Prize
$30,000
#48
$2
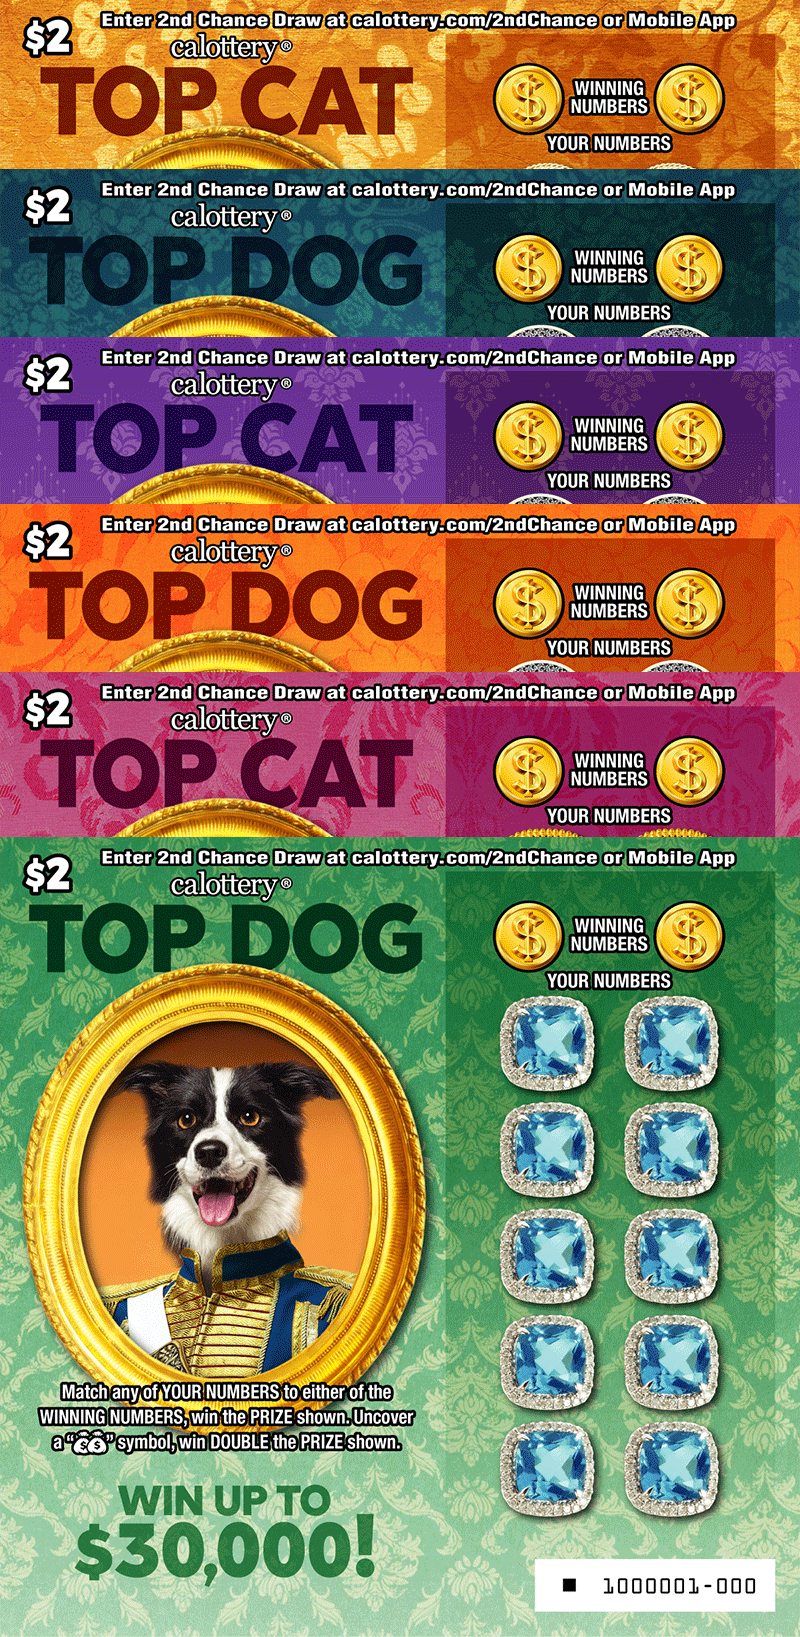
Top Dog Top Cat
Current Odds
1 in 3.94
+5.44%
Top Prize
$30,000
#49
$2
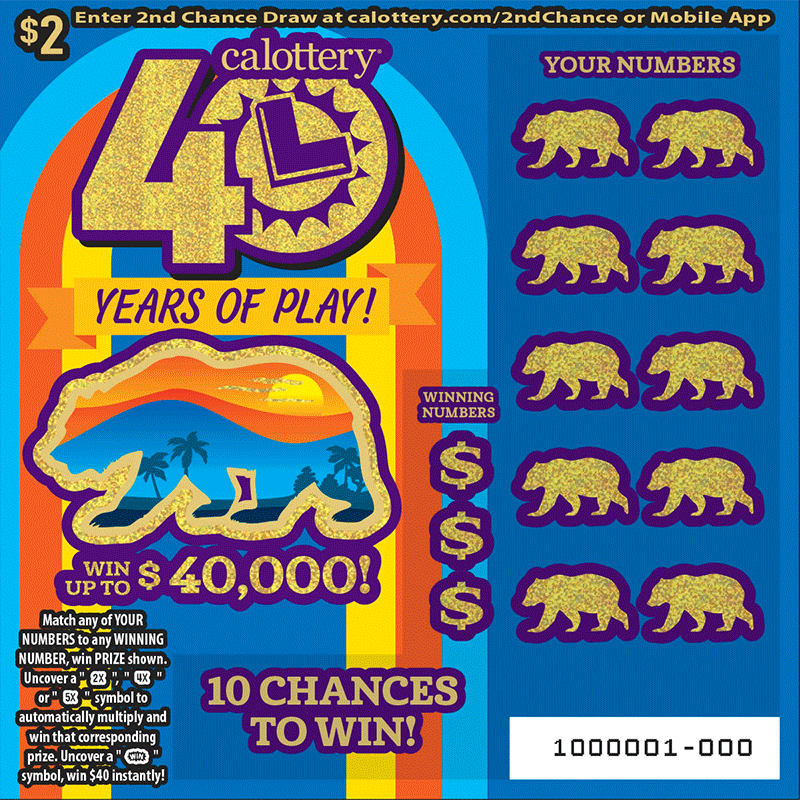
40 Years of Play!
Current Odds
1 in 3.97
+4.27%
Top Prize
$40,000
#50
$2
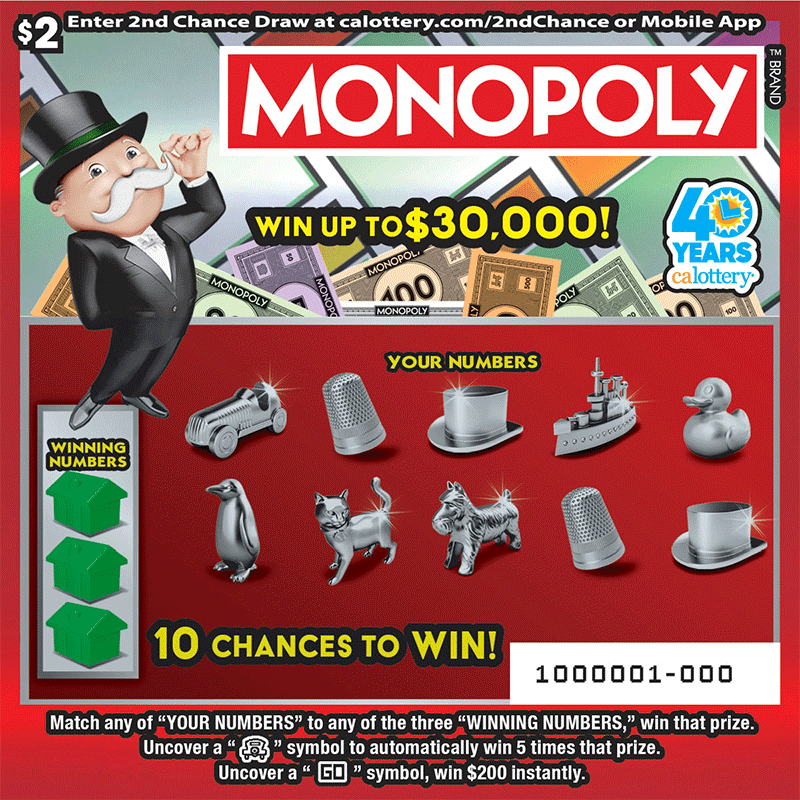
MONOPOLY
Current Odds
1 in 4.05
+1.19%
Top Prize
$30,000
#51
$1

Beginner's Luck
Current Odds
1 in 4.13
+2.38%
Top Prize
$5,000
#52
$2
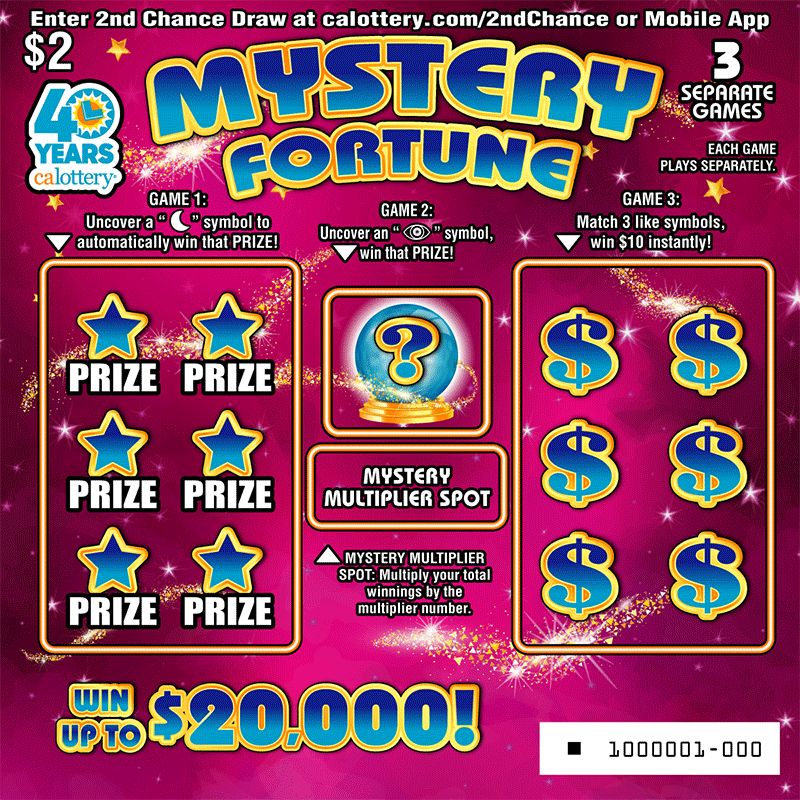
Mystery Fortune
Current Odds
1 in 4.17
-2.07%
Top Prize
$20,000
#53
$1
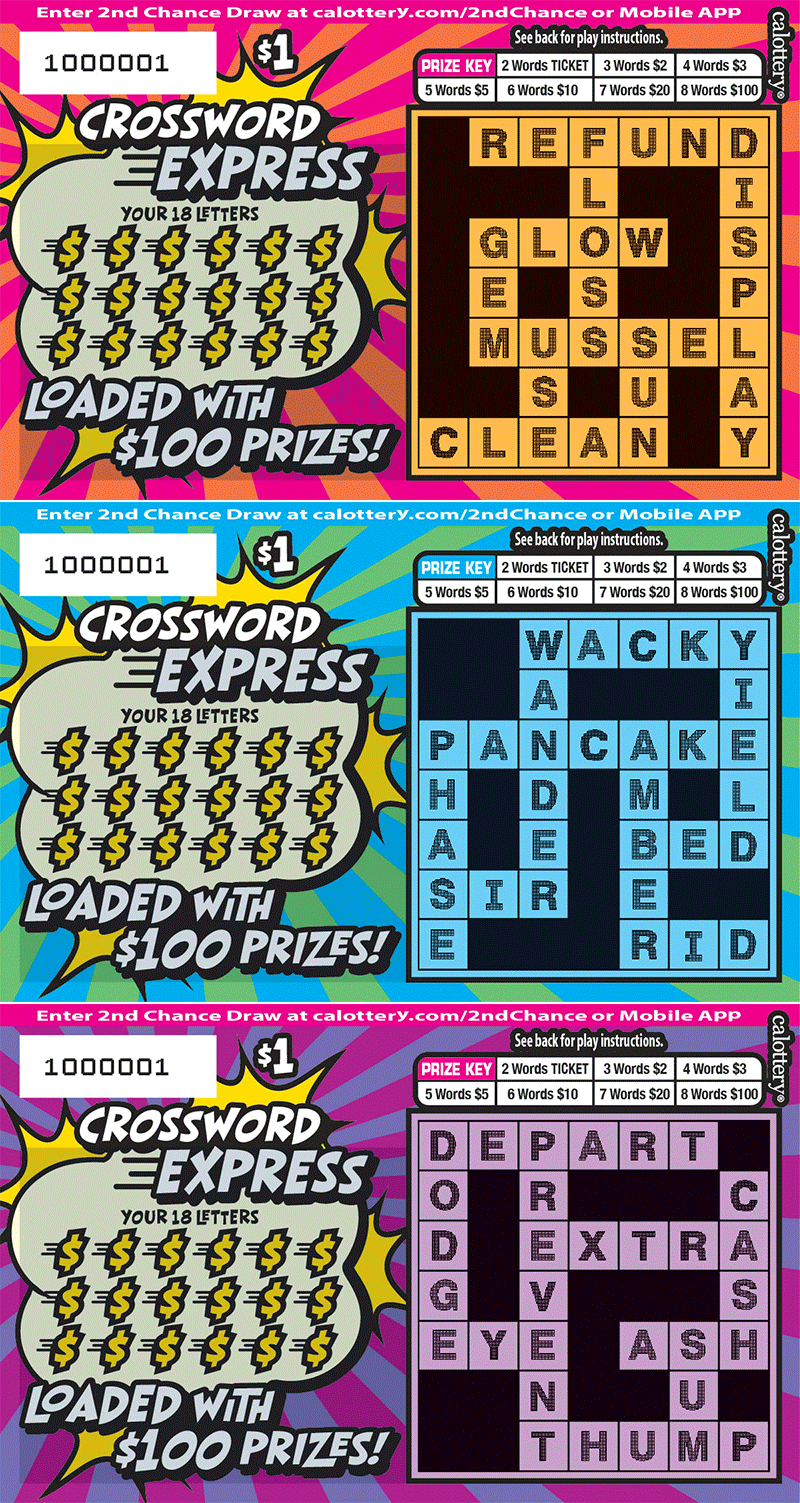
Crossword Express
Current Odds
1 in 4.18
+13.37%
Top Prize
$100
#54
$1
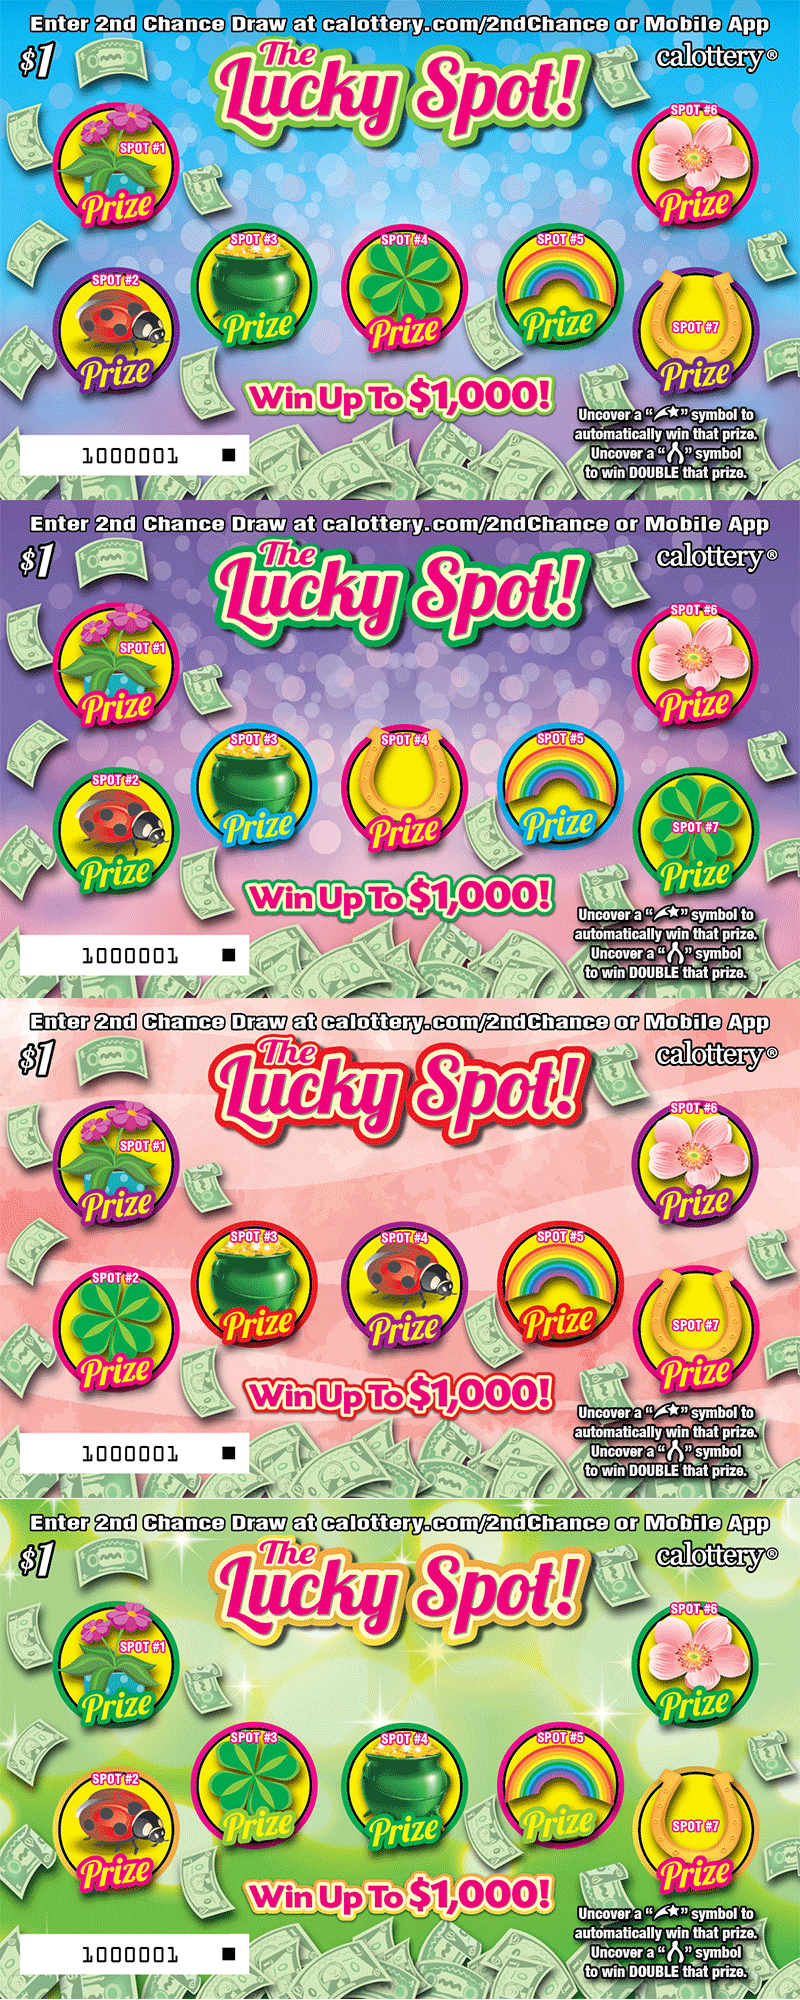
The Lucky Spot!
Current Odds
1 in 4.24
+12.16%
Top Prize
$1,000
#55
$5
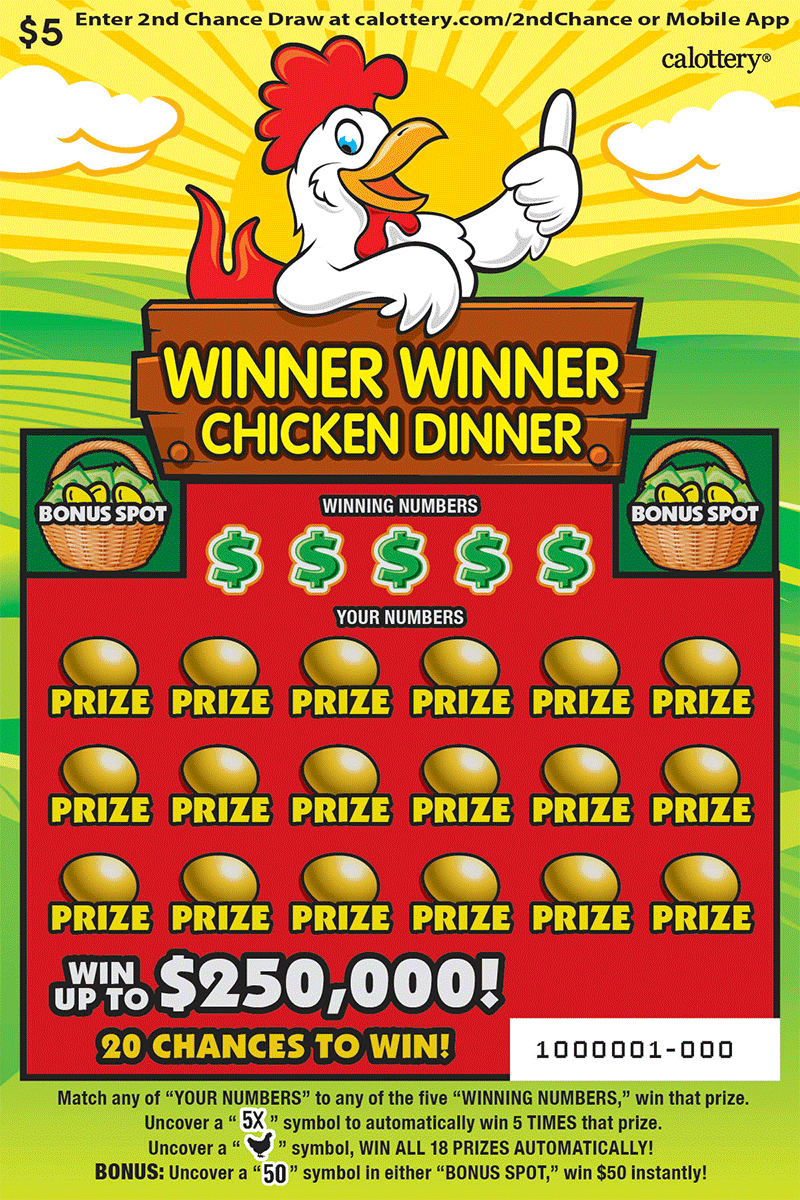
Winner Winner Chicken Dinner
Current Odds
1 in 4.35
+6.47%
Top Prize
$250,000
#56
$2
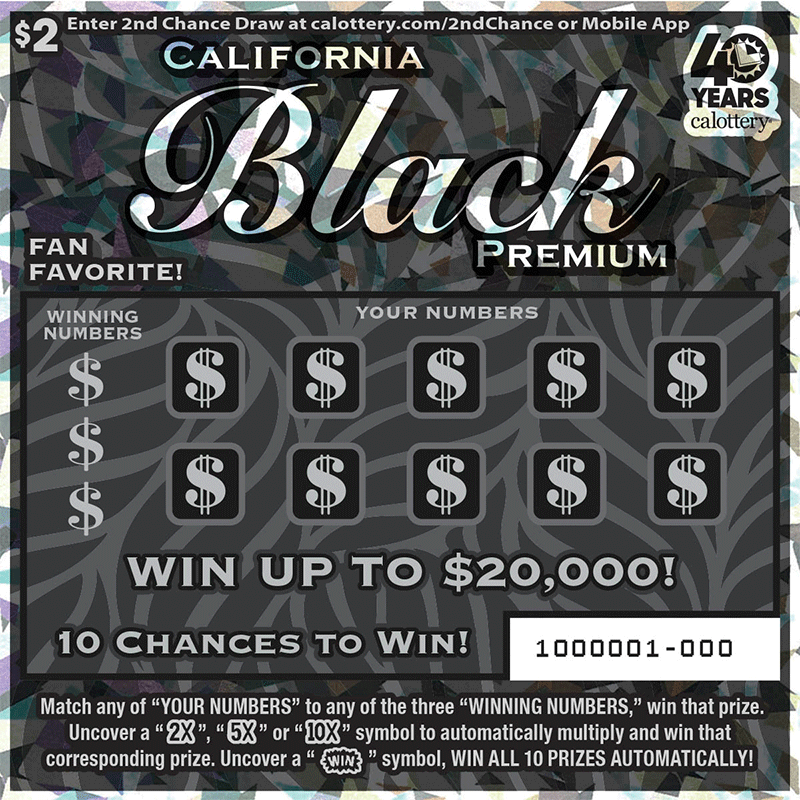
California Black Premium
Current Odds
1 in 4.35
-6.56%
Top Prize
$20,000
#57
$1
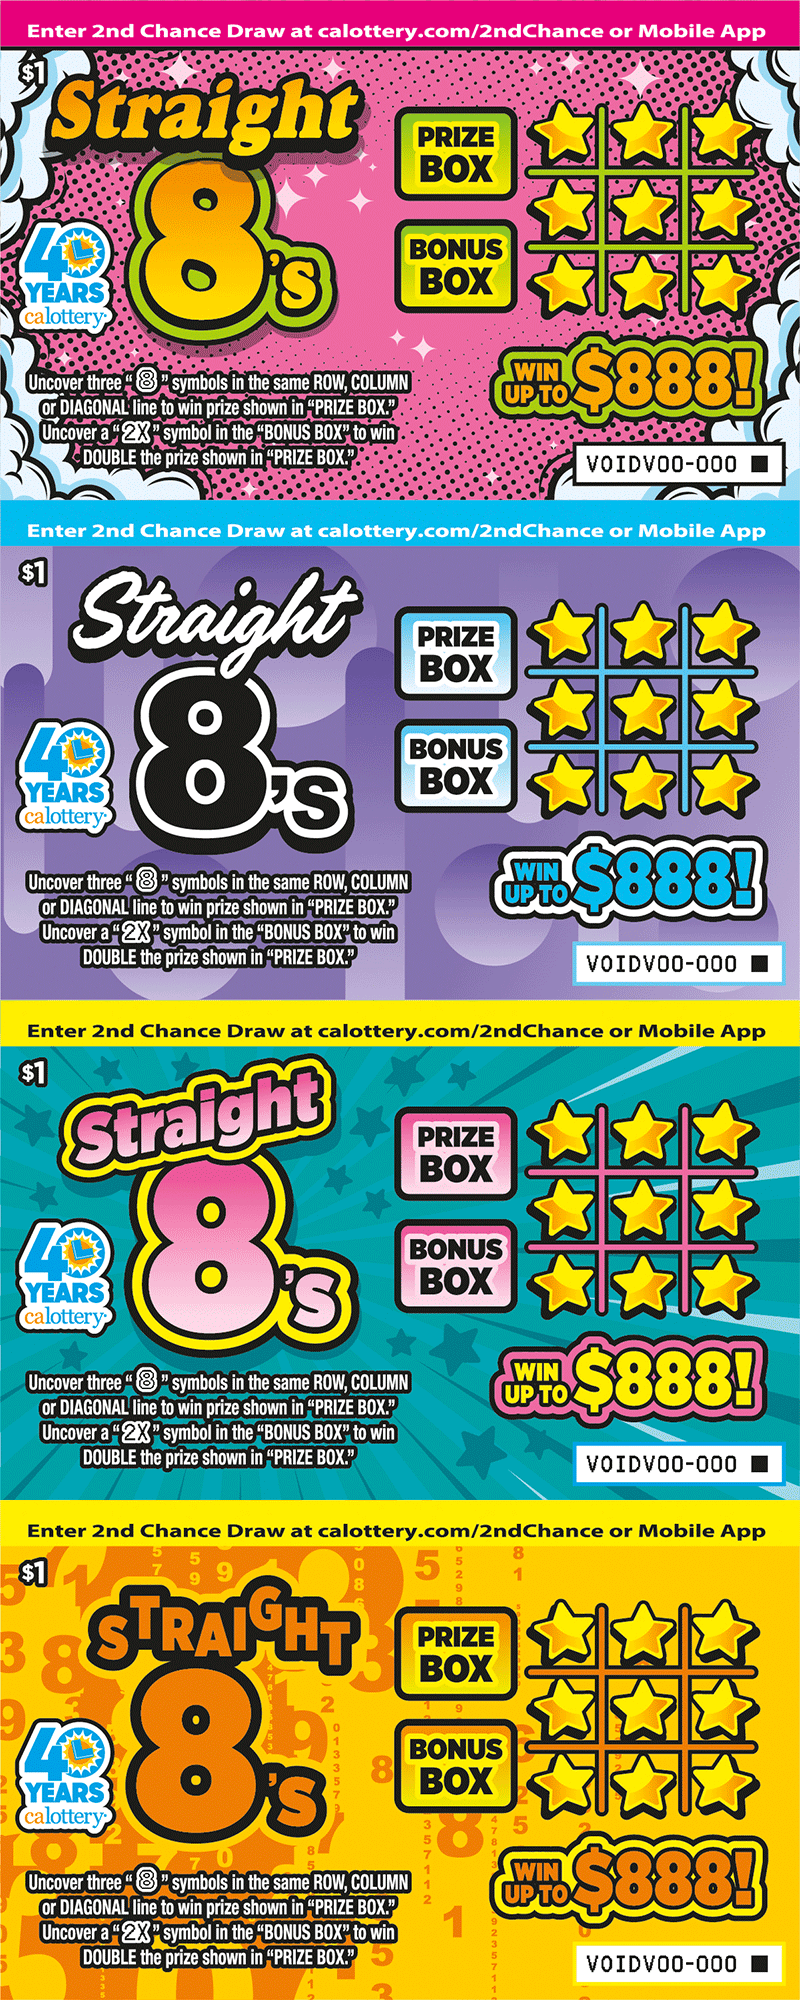
Straight 8's
Current Odds
1 in 4.46
+6.70%
Top Prize
$888
#58
$2
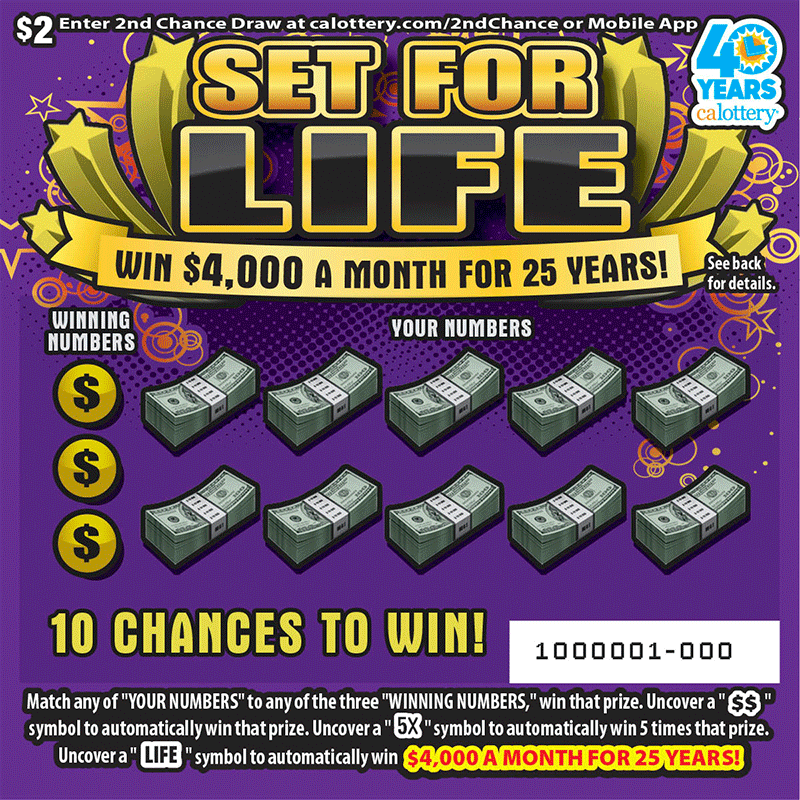
Set for Life
Current Odds
1 in 4.46
-0.51%
Top Prize
$1,200,000
#59
$2

$30,000 Cash Blast
Current Odds
1 in 4.61
-11.06%
Top Prize
$30,000
#60
$5
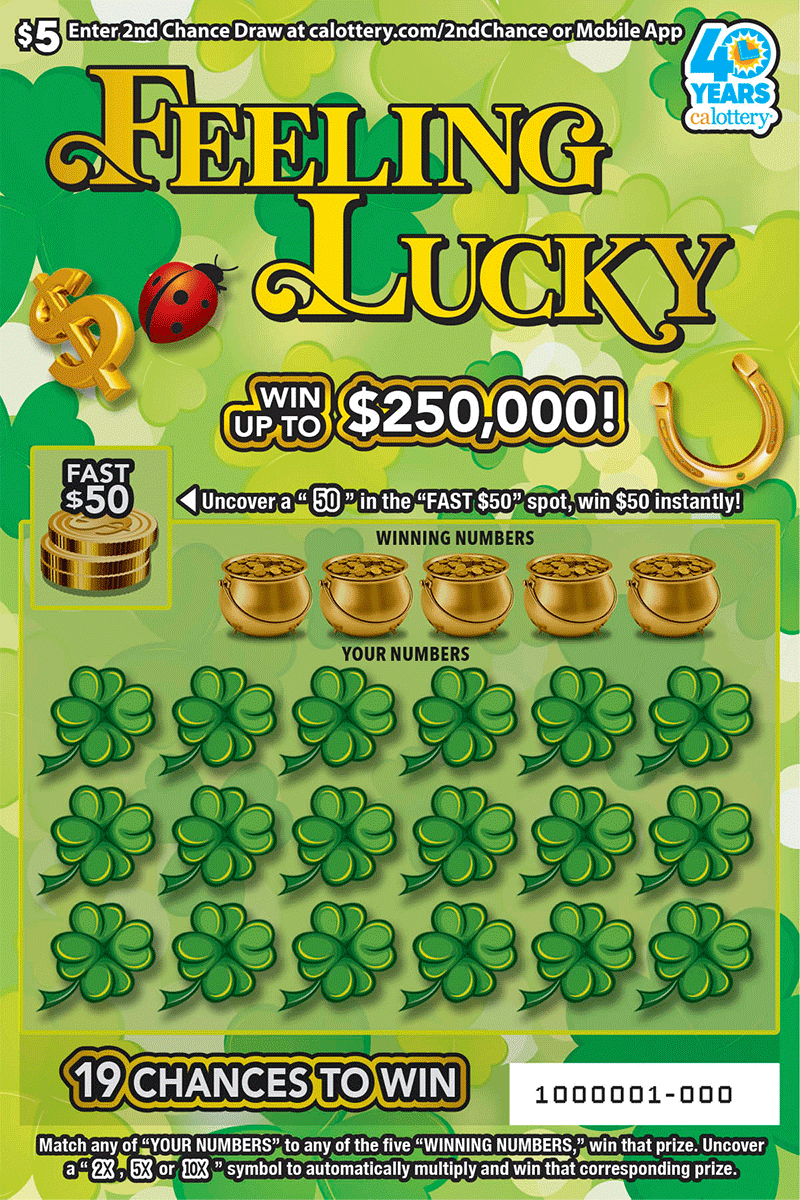
Feeling Lucky
Current Odds
1 in 4.9
-5.38%
Top Prize
$250,000
#61
$20
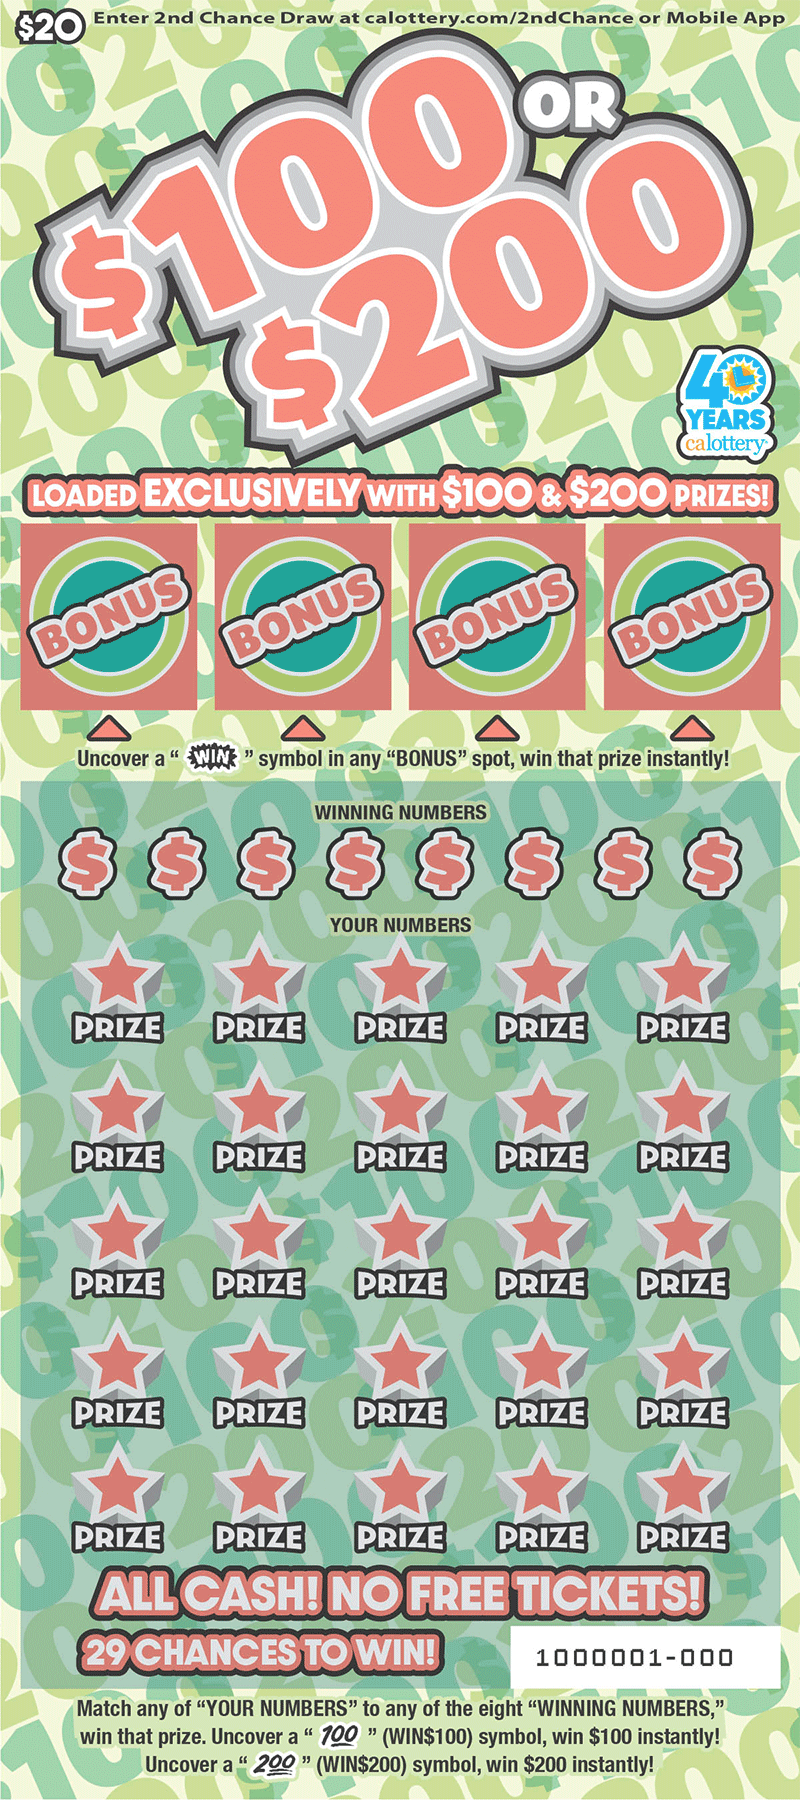
$100 or $200
Current Odds
1 in 7.9
+0.49%
Top Prize
$200
#62
$10
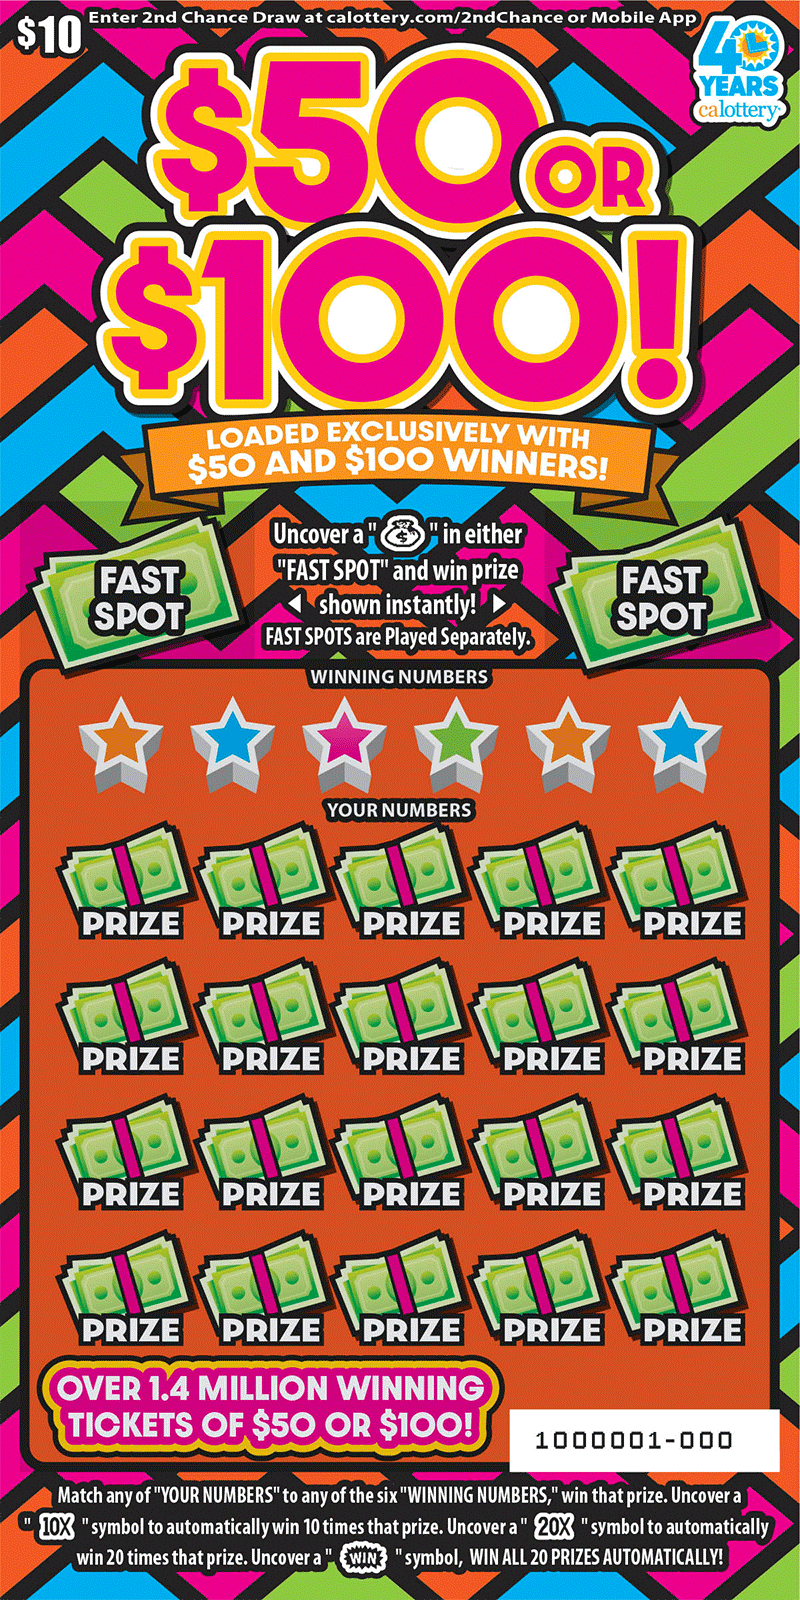
$50 or $100!
Current Odds
1 in 8.18
-0.58%
Top Prize
$100
