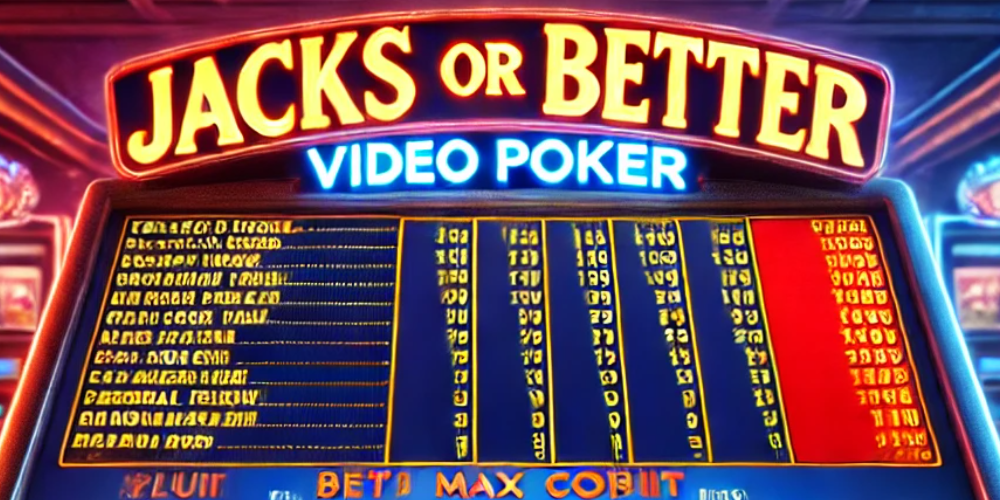
Jacks or Better is the most popular variant of video poker, beloved for its straightforward rules and excellent odds. Its simplicity makes it accessible, but mastering the game requires a clear understanding of optimal strategies and payout tables.
Why Payout Tables Are Critical in Jacks or Better
A payout table in video poker determines exactly how much each winning hand will pay, directly influencing your expected returns. Even slight changes in payout amounts can significantly alter your potential earnings. In Jacks or Better, different payout tables—like “9/6,” “8/5,” or “6/5″—dramatically change your overall returns.
For example:
- 9/6 “Full-Pay” Table:
A full house pays 9 coins, a flush pays 6, offering an exceptional 99.54% return with optimal strategy. - Lower-paying Tables (e.g., 8/5, 7/5, 6/5):
These tables significantly reduce your potential return and change optimal strategy considerations.
Before playing, always verify the payout table. Our detailed Jacks or Better optimal strategy pages outline precisely how to adjust your play according to the specific table you choose.
Illustration: Typical Casino Jacks or Better Payout Table
Here’s an example of a common “full-pay” 9/6 payout table found in casinos:
| Hand | 1 | 2 | 3 | 4 | 5 |
|---|---|---|---|---|---|
| Royal Flush | 250 | 500 | 750 | 1000 | 4000 |
| Straight Flush | 50 | 100 | 150 | 200 | 250 |
| Four of a Kind | 25 | 50 | 75 | 100 | 125 |
| Full House | 9 | 18 | 27 | 36 | 45 |
| Flush | 6 | 12 | 18 | 24 | 30 |
| Straight | 4 | 8 | 12 | 16 | 20 |
| Three of a Kind | 3 | 6 | 9 | 12 | 15 |
| Two Pair | 2 | 4 | 6 | 8 | 10 |
| Jacks or Better | 1 | 2 | 3 | 4 | 5 |
As you can see, payouts scale with the number of coins wagered, making maximum bets essential for achieving the highest EV.
Why Betting Maximum Coins is Essential
In video poker, particularly Jacks or Better, always betting the maximum (usually five coins) is crucial. This significantly improves your long-term return:
- Royal Flush Bonus:
Betting five coins unlocks the maximum Royal Flush payout (4,000 coins), dramatically boosting your expected return compared to lower coin bets. - Higher Expected Value (EV):
Your long-term returns depend on optimal play combined with the best payouts—both hinge on betting max coins.
What is Expected Value (EV), and Why Does it Matter?
Expected Value (EV) measures the average amount you can expect to win or lose per bet over the long run, assuming perfect strategic play. Games with higher EV mean better long-term returns. For example, the full-pay Jacks or Better (9/6) has a 99.54% EV—meaning, with optimal play, you can expect to average 99.54 cents returned for every dollar wagered over time.
All our EV calculations are rigorously verified and computed with robust mathematical modeling and computer simulations, ensuring you get accurate strategies and reliable recommendations.
To explore detailed optimal plays for specific Jacks or Better payout tables, visit our detailed Jacks or Better Strategy page.
Importance of EV (Expected Value)
Expected Value (EV) indicates your average return per dollar bet, assuming you always wager maximum coins and follow optimal strategy. An EV close to 1 (or 100%) means you can expect minimal house edge, with a few variants even surpassing 100%, effectively eliminating the house advantage altogether.
Below is the comprehensive list of Jacks or Better payout tables sorted by their Expected Values, assuming optimal play and maximum coin bets:

